FlexGrid has always supported hierarchical data in various forms, like master/detail, data grouping, tree-style grouping, and row details. It has always been simple to group data into rows and manipulate those groups. However, until now, there wasn't an easy way to group data into columns. We received numerous requests for this feature and we created samples to show how to do it, but it required a fair amount of code.
The latest release of the FlexGrid adds support for column groups, and they are super-easy to use.
For example, imagine you have some data where each item contains a hierarchical list of assets:
let data = [
{
    name: 'Constant Growth', currency: 'USD',
    perf: { ytd: .0523, m1: 0.0142, m6: 0.0443, m12: 0.0743 },
    alloc: { stock: 0.17, bond: 0.32, cash: 0.36, other: 0.15, amount: 23432 }
}, {
    name: 'Optimus Prime',
    currency: 'EUR',
    perf: { ytd: .0343, m1: 0.043, m6: 0.0244, m12: 0.0543 },
    alloc: { stock: 0.61, bond: 0.8, cash: 0.9, other: 0.22, amount: 43223 }
}, {
    name: 'Crypto Planet',
    currency: 'BTC',
    perf: { ytd: .0343, m1: 0.014, m6: 0.034, m12: 0.01243 },
    alloc: { stock: 0.1, bond: 0, cash: 0, other: 0.9, amount: 2234 }
}, { …
You could bind this data to a FlexGrid without any problem.
For example:
let theGrid = new FlexGrid('#theGrid', {
  autoGenerateColumns: false,
  columns: [
    { binding: 'name', header: 'Name', width: 150 },
    { binding: 'currency', header: 'Curr', width: 80, align: 'center' },
    { binding: 'perf.ytd', header: 'Perf/YTD', format: 'p2', width: 100 },
    { binding: 'perf.m1', header: 'Perf/1M', format: 'p2', width: 80 },
    { binding: 'perf.m6', header: 'Perf/6M', format: 'p2', width: 80 },
    { binding: 'perf.m12', header: 'Perf/12M', format: 'p2', width: 80 },
    { binding: 'alloc.stock', header: 'Stocks', format: 'p0', width: 80 },
    { binding: 'alloc.bond', header: 'Bonds', format: 'p0', width: 80 },
    { binding: 'alloc.cash', header: 'Cash', format: 'p0', width: 80 },
    { binding: 'alloc.other', header: 'Other', format: 'p0', width: 80 },
    { binding: 'alloc.amount', header: 'Amount', format: 'c0', width: 100 }
  ],
  itemsSource: getFundData()
});
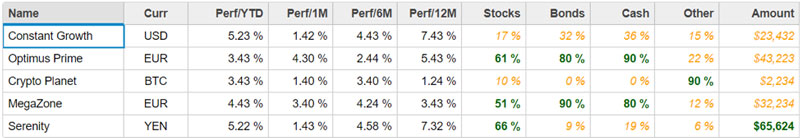
And you would get a perfectly fine result:
But with the latest version of the FlexGrid, you can get a much better result by setting the columnGroups property to a hierarchical version of the column data:
llet theGrid = new FlexGrid('#theGrid', {
  autoGenerateColumns: false,
  columnGroups: [
    { binding: 'name', header: 'Name', width: 150 },
    { binding: 'currency', header: 'Curr', width: 80, align: 'center' },
    { header: 'Perf', align: 'center', collapseTo: 'perf.ytd', columns: [
      { binding: 'perf.ytd', header: 'YTD', format: 'p2', width: 100 },
      { binding: 'perf.m1', header: '1 M', format: 'p2', width: 80 },
      { binding: 'perf.m6', header: '6 M', format: 'p2', width: 80 },
      { binding: 'perf.m12', header: '12 M', format: 'p2', width: 80 }
    ]},
    { header: 'Allocation', align: 'center', collapseTo: 'alloc.amt', columns: [
      { binding: 'alloc.stock', header: 'Stocks', format: 'p0', width: 80 },
      { binding: 'alloc.bond', header: 'Bonds', format: 'p0', width: 80 },
      { binding: 'alloc.cash', header: 'Cash', format: 'p0', width: 80 },
      { binding: 'alloc.other', header: 'Other', format: 'p0', width: 80 },
      { binding: 'alloc.amount', header: 'Amount', format: 'c0', width: 100 }
    ]}
  ],
  itemsSource: getFundData()
});
The column data is almost identical, except for the addition of two "parent" columns which contain others in their "columns" property.
This is the result: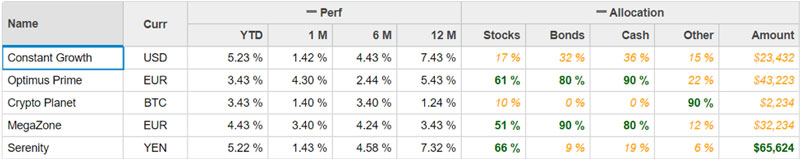
Now the performance and allocation data are grouped under different headings, which makes the information a lot easier to understand.
And since the columns are already divided into groups, we allow you to specify a "collapseTo" column in each group. This makes the group collapsible and defines which column should remain visible when the group is collapsed.
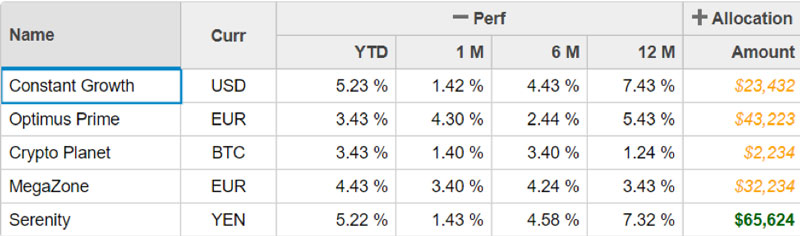
For example, a user interested in analyzing performance may choose to collapse the allocation information to get this view:
You may group columns to any level: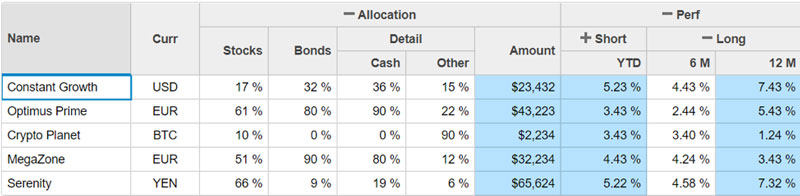
The best part is you can do all this declaratively, without writing any code at all.
We hope you enjoy this new feature!

Bernardo de Castilho