Getting Started with ActiveReportsJS
ActiveReportsJS is a set of tools that allows you to create and integrate reports into rich client web applications. It includes a cross-platform designer, viewer, and export modules to embed into your application.
In this post, we will demonstrate how to use each of these items and get you on your way to creating awesome reports.
Download Tools to Create JavaScript Reports
First, download ActiveReportsJS here. There are three different download options. Select the appropriate platform for your machine.

The download includes the ActiveReportsJS designer, viewer, and export modules mentioned above. By default, you have a 30-day trial to use the product.
After download, unzip the file, and go to the designer folder. Double-click the .dmg/.exe/.AppImage file to install the designer.
When you open the application, you will see a banner in the menu displaying the trial period (you can ignore this). Continue using the designer to explore all of its features.
Creating JavaScript Reports
From adding data sources to creating interactive reports, the ActiveReportsJS Designer allows you to take full control of the reports. Report Designers will find report design and creation very easy with this tool.
To create a report, select the “File” option in the main menu bar. The File panel will open and give you the option to create a RDL or Page Report. Generally, the RDL report type is used for reports that can scale based on the size of the rendering area. It allows report controls to grow or shrink at runtime.
The Page report type is layout-driven. Page reports are best suited for reports that need strict layout constraints and remain a fixed size.
For this example, select a Page Report.

Adding Data Sources
Since ActiveReportsJS is a JavaScript product, JSON is the acceptable data format. To get started using the Designer, let’s add a JSON data source. Navigate to the Data panel by clicking on the “Data” icon in the upper right submenu.
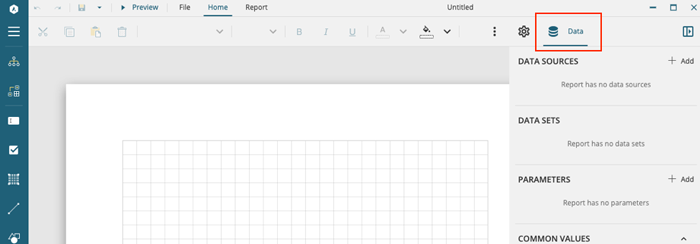
Click the “+” button under the “Data Sources.” A dialog like this will appear.
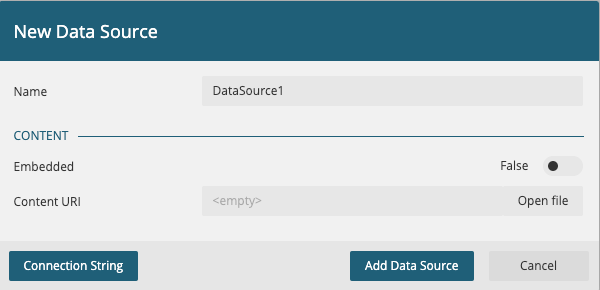
There are several options to configure your data source.
- Use a local JSON file
- Connect to a report service
- Use a connection string

If you have a local JSON file that you would like to use, change “Embedded” to true. Then, click “Load from file” and select your file. Your file will be displayed in the Embedded Content section.
To connect to a report service,copy the URI to the service into “Content URI.” You can also load this from a local database file.
After the Data Source is properly configured, click “Add Data Source” to complete.
The next step is to create a Data Set, which is a subset of the data from your data source. You can create multiple data sets from a single data source. Select the plus icon next to the data source just created.

To create a data set, you need to construct a query string that returns the desired data fields.

For example, the following query string will return all Products from the Products array in my file.
$.Products[*]
Make sure your query string captures the right fields by clicking the "Validate" button. The "Bound Fields" section will populate with the field items.
For more information about creating data sets, refer to the <a href=/activereportsjs/docs/DeveloperGuide/ActiveReportsJSDesigner/Databinding/" target="_blank">documentation.
Designing your JavaScript Report
Once the data sources and data sets are set up, it is time to begin designing the report layout. The ActiveReportsJS designer has many report controls that make this very easy to do. The left side of the designer lists icons for each report control. Click the “Menu” icon to expand the left control panel. With all report controls available, you can create many different layouts for your reporting. The list of controls includes Tables, Barcodes, Images, Table of Contents, Charts, and more.
There are thousands of features to use, so spend some time exploring the report controls and their functions on your own. If you want more detailed instructions on how to use a specific control, refer to the Report Controls section of the documentation.
In this example, I will add a Table control to list some Employee data. I will cover a few details about the Table control to get you started.
Adding a Table Control
To use any control, double-click or Click-n-Drag a control. The control will appear on the design surface. For the Table control, you will notice that it already has 3 rows and 3 columns by default.

You can add or remove the rows and columns using the right-click option. The 3 rows displayed are:
- Header row
- Details row
- Footer row
The Details row is ideal for binding data using Expressions. Additional rows will be added to this section based on the number of entries in your data set at run time. You will notice, when hovering over a cell, a button Field Selection Adorner appears in the cell. Click the adorner and select the Field you want to bind to the cell.
The resulting cell will contain an expression for the value selected. Selecting an expression in the details row also binds that field to the entire column. To display data in cells, add a few more expressions to the other cells in the details row.

In my example, I have selected the following fields and removed the footer row. If you select a Field from the DataSet, you will also notice that the header rows populate automatically. The last column is the total value of the product (Unit Price * Units In Stock).

Now, if you preview the report, you will see all records displayed with the corresponding fields in the report.

You can take advantage of the report control properties to enhance the visualization of the report, but I will skip this step. Let's assume we have a report designed to our liking and proceed with integrating our report into an application.
Adding ActiveReportsJS to Your Application
To display reports, we need a viewer to render the report file. The ActiveReportsJS viewer can easily be added to an application with a few lines of code. Before this, you will need to add the ActiveReportsJS files to the application.
Setup
Start by creating a simple web application. At minimum just create a basic HTML file.
Example:
<!DOCTYPE html>

<html>
    <head>
        <meta charset="utf-8">
        <meta http-equiv="X-UA-Compatible" content="IE=edge">
        <title>ActiveReportsJS Demo</title>

        <meta name="description" content="Demo application of ActiveReportsJS Viewer and Report file">
        <meta name="viewport" content="width=device-width, initial-scale=1">

        <script src="app.js"></script>

    </head>
    <body>

    </body>
</html>
In the ActiveReportsJS download, the dist/ folder contains the JS and CSS files we need to add to our application. Copy the dist folder to a local folder in your application.

ActiveReportsJS is also available via NPM, so we can install the components using the following command for a Node based application.
npm i @grapecity/activereports
Now we are ready to use the ActiveReportsJS in our application.
Referencing the Components
To use ActiveReportsJS in the application, you'll need the relative file path to the files in your application folder. Add references to the JS and CSS files in the section of your application. In the example below, the files are located in the vendor/ folder.
<script src="vendor/dist/ie-polyfills.full.js"></script>
<script src="vendor/dist/ar-js-core.js"></script>
<script src="vendor/dist/ar-js-viewer.js"></script>
<script src="vendor/dist/ar-js-pdf.js"></script>
  <script src="vendor/dist/ar-js-xlsx.js"></script>
<script src="vendor/dist/ar-js-html.js"></script>

<link rel="stylesheet" href="vendor/styles/ar-js-viewer.css">
Configure Viewer
After adding references, the application can use the components. Add a host element for the viewer to the body section. Use a <div> with a unique identifier.
<body>
  <div id="viewer"></>
</body>
Next, instantiate the viewer using the host element's ID. You can also copy this and place into a <script> tag in your HTML file. In my example, the code below resides in app.js file.
document.readyState === 'complete' ? init() : window.onload = init;

function init() {
    const viewer = new ActiveReports.Viewer('#viewer');
    viewer.open("./reports/myReport.rdlx-json");
}
The first statement in the init function creates a viewer control. The second line loads a report into the viewer. In order for the report to load, you need to add it to the application. Save the report created earlier and add it to your application folder. In this example, the file path indicates that the report is in the reports/ folder.
A more common scenario is to open a report from report service. In that case, you may pass a URI to the viewer.open() method.
Example:
function init() {
    const viewer = new ActiveReports.Viewer('#viewer');
    viewer.open("https://myreportservice.com/reports/../..");
}
View Report
Now the application is properly configured to use ActiveReportsJS. Let’s run our application and view it in the browser.
To preview, spin up a lightweight server. VSCode Live Server extension or Web Server for Chrome are quick and easy to use.
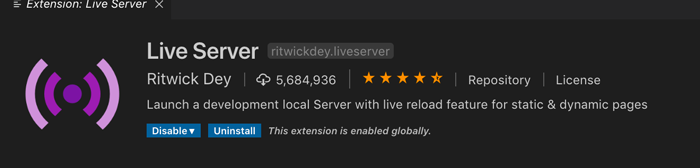
The VS Code Live Server extension has a nice shortcut integrated into the UI for starting and stopping the server.
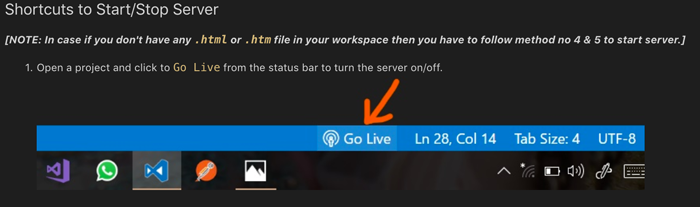
Make sure you are in the correct folder when using these tools. Now, when we view our report in the browser, we can see the report displayed in the viewer.

We covered the basics here; however, there are many ways to create or design a report layout. Integrating reports into your application is straightforward and only requires a few steps. You can also use popular JavaScript frameworks with the Viewer component.
Additional Reading
-
Refer to the documentation for implementation details.
-
For more report samples and examples of using ActiveReportsJS, refer to the demos.
-
You can find more information on licensing here.
-
This article and video demonstrates how to get started with the ActiveReportsJS Designer

Troy Taylor