How to Build a Choropleth Country GDP Map in ASP.NET Core MVC
In the 2021v2 release, Grapecity introduced FlexMap control for visualization of Geographical data on web pages. In this blog, we will discuss various scenarios for using this control.
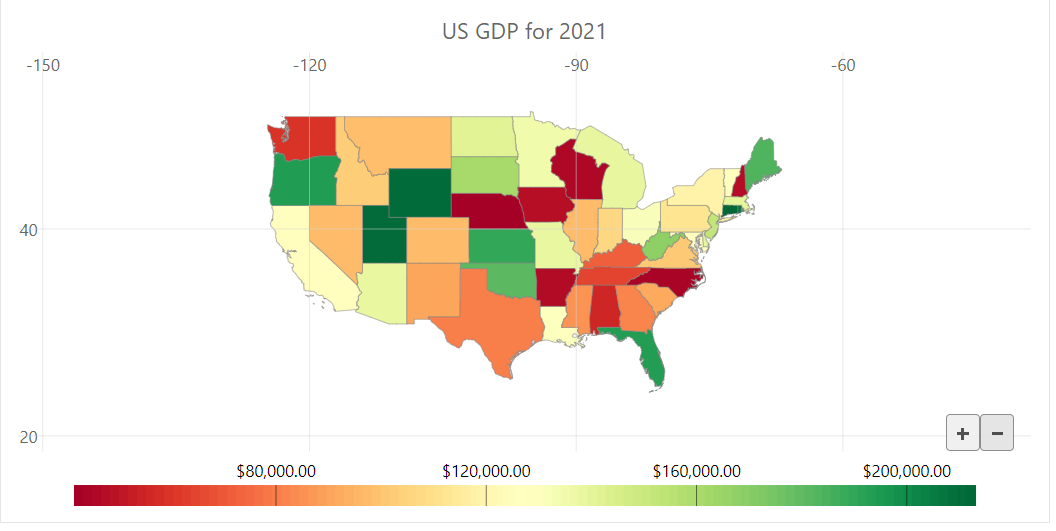
Let's say we wanted to visualize GDP for the USA and its various states. You can display this using the Choropleth maps where each State is colored based on the GDP data it represents.
Here is an example:

Before we dive into creating the GDP map, here is a list of the FlexMap features we will use to create it.
GeoMapLayer
GeoMapLayer is used to display the land map, using the provided GeoJSON geographical data.
Add the following code to the map for the land:
<script>
function itemsSourceChanged(s, e) {
        var flexmap = wijmo.Control.getControl("#flexmap");
        // zoom Map to fit in the box
        flexmap.zoomTo(s.getGeoBBox());
    }
</script>
<c1-flex-map id="flexmap" header="US GDP for 2021" height="500px" width="1000px">
    <c1-geo-map-layer url="./content/US.json" items-source-changed="itemsSourceChanged">
    </c1-geo-map-layer>
</c1-flex-map>

ColorScale
ColorScale transforms the values to color for the FlexMap. ColorScale’s binding property requires the method to fetch the values against the key from the Map() class instance using the get() method. The data is set using the set() method for the map instance.
<script>
var map = new Map();
    var data = @Html.Raw(Json.Serialize(Model));
    data.forEach(el => map.set(el.state, parseFloat(el.y2021)));
    function getMapData(obj) {
       return map.get(obj.properties.name);
    }
</script>
<c1-flex-map id="flexmap" header="US GDP for 2021" height="500px" width="1000px">
    <c1-geo-map-layer url="./content/US.json" items-source-changed="itemsSourceChanged">
        <c1-color-scale colors="Palettes.Diverging.RdYlGn" format="c2" binding="getMapData">
        </c1-color-scale>
    </c1-geo-map-layer>
</c1-flex-map>
Tooltip
Tooltip is a powerful feature for Data Visualization controls. Tooltip is used to display the information for the targeted point or area. In FlexMap, the tooltip can be displayed using the pop-up event handler when the content cannot display the required information.
<script>
function getMapTooltip(tip) {
        return `${tip.name} - $${map.get(tip.name)}`;
}
    function onOpenTooltip(s, e) {
        if (!wijmo.isFunction(s.content)) {
            s.content = getMapTooltip;
            e.cancel = true;
        }
    }
</script>

<c1-flex-map id="flexmap" header="US GDP for 2021" height="500px" width="1000px">
    <c1-flex-chart-tooltip show-delay="5" content="{name}" popup="onOpenTooltip"></c1-flex-chart-tooltip>
   ...
</c1-flex-map>
Legend
The legend is displayed as a range with the specified colors for ColorScale. It displays the colors as a linear gradient while showing the color values in the FlexMap.
<c1-flex-map id="flexmap" header="US GDP for 2021" height="500px" width="1000px">
    <c1-chart-legend position="Bottom"></c1-chart-legend>
….
  </c1-flex-map>

Change DataSource for FlexMap’s ColorScale
For ColorScale binding, the Map object is used with a function to retrieve the key value for a specified location. Therefore, to update FlexMap data, we will use another function to fetch the other data to display on the map. We will then need to call the Control.invalidate(true) method to re-render the FlexMap with the new data.
In this example, we will display three-year GDP data from the US in FlexMap. There will be three instances of the map for each year, along with three distinct functions to retrieve the value for each year.
These functions would be called for the ColorScale.binding to display the respective year's data. After calling the function, we will call the flexmap.invalidate(true) method.
<script>
    var data = @Html.Raw(Json.Serialize(Model));
    var map2021 = new Map();
    var map2020 = new Map();
    var map2019 = new Map();

    data.forEach(el => map2021.set(el.state, parseFloat(el.y2021)));
    data.forEach(el => map2020.set(el.state, parseFloat(el.y2020)));
    data.forEach(el => map2019.set(el.state, parseFloat(el.y2019)));

    function getGDPYear2021(obj) {
        return map2021.get(obj.properties.name);
    }
    function getGDPYear2020(obj) {
        return map2020.get(obj.properties.name);
    }
    function getGDPYear2019(obj) {
        return map2019.get(obj.properties.name);
    }

    var year = 2021;
    function getMapTooltip(tip) {
        return `${tip.name} - $${data.find(x => x.state == tip.name)['y'+year]}`;
    }

    function showGDP2021() {
        year = 2021;
        flexmap.header = "US GDP for " + year;
        var colorscale = flexmap.layers[0].colorScale;
        colorscale.binding = getGDPYear2021.bind(this);
        flexmap.invalidate(true);
    }

    function showGDP2020() {
        year = 2020;
        flexmap.header = "US GDP for " + year;
        var colorscale = flexmap.layers[0].colorScale;
        colorscale.binding = getGDPYear2020.bind(this);
        flexmap.invalidate(true);
    }

    function showGDP2019() {
        year = 2019;
        flexmap.header = "US GDP for " + year;
        var colorscale = flexmap.layers[0].colorScale;
        colorscale.binding = getGDPYear2019.bind(this);
        flexmap.invalidate(true);
    }
</script>

ScatterMapLayer
ScatterMapLayer is used to display the information in a dotted form. This requires the JSON to consist of the following properties:
- X: Co-ordinate x
- Y: Co-ordinate y
- GDP: Value (Bubble Size)
Along with these properties, we can provide additional properties to show the information using the tooltip. Use these properties as binding, separated with comma (,), such as “X,Y,GDP”.
For a demo sample and code snippet, refer to the demo sample.
GeoGridLayer
GeoGridLayer is used to display the location coordinates. The coordinates are the latitude and longitude of the location.
<c1-flex-map id="flexmap" header="US GDP for 2021" height="500px" width="1000px">
    …
    <c1-geo-grid-layer ></c1-geo-grid-layer>
</c1-flex-map>
Download ComponentOne | Demo Sample

Manish Gupta