Posted 30 October 2018, 5:03 pm EST
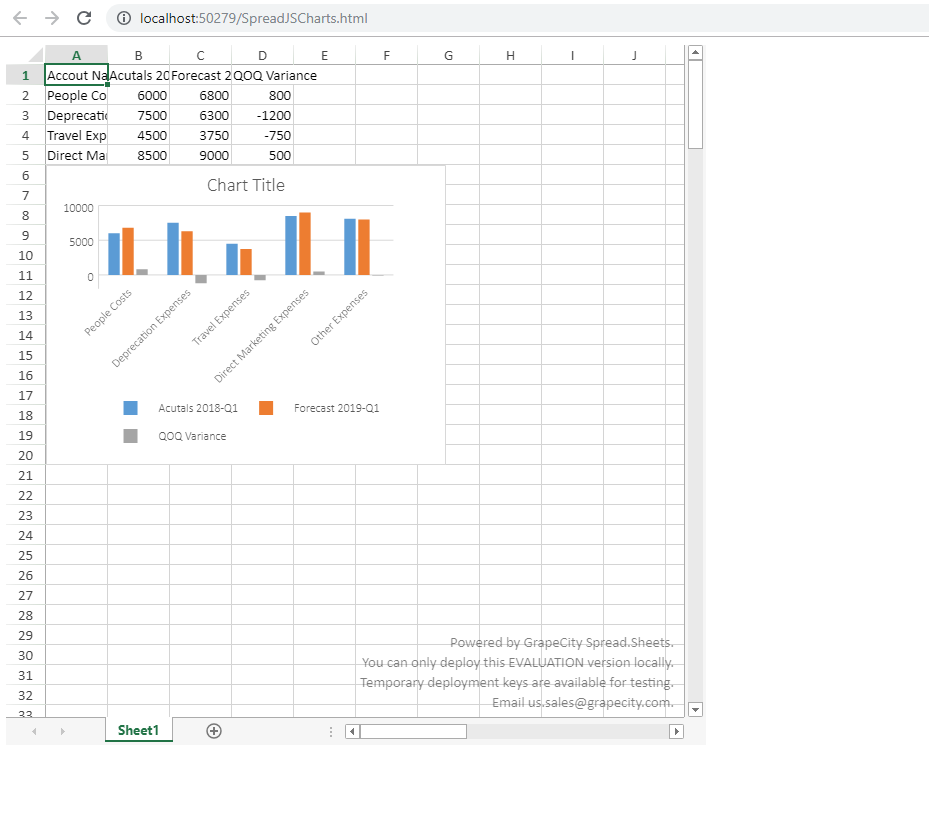
i am using the attached html file to modify & set the axes related properties. but it not showing the axes related labels in the chart.
Forums Home / Spread / SpreadJS
Posted by: hghanta on 30 October 2018, 5:03 pm EST

hghanta
Posted 30 October 2018, 5:03 pm EST
i am using the attached html file to modify & set the axes related properties. but it not showing the axes related labels in the chart.
hghanta
Posted 30 October 2018, 5:15 pm EST
Adding File SpreadJSCharts.zip

grapecity
Posted 30 October 2018, 7:42 pm EST - Updated 3 October 2022, 2:04 am EST
grapecity
Posted 1 November 2018, 1:39 am EST
Hello,
I am able to replicate this issue at my end. We will further investigate it and let you know.
Thanks,
Deepak Sharma
grapecity
Posted 2 November 2018, 12:12 am EST
Hello,
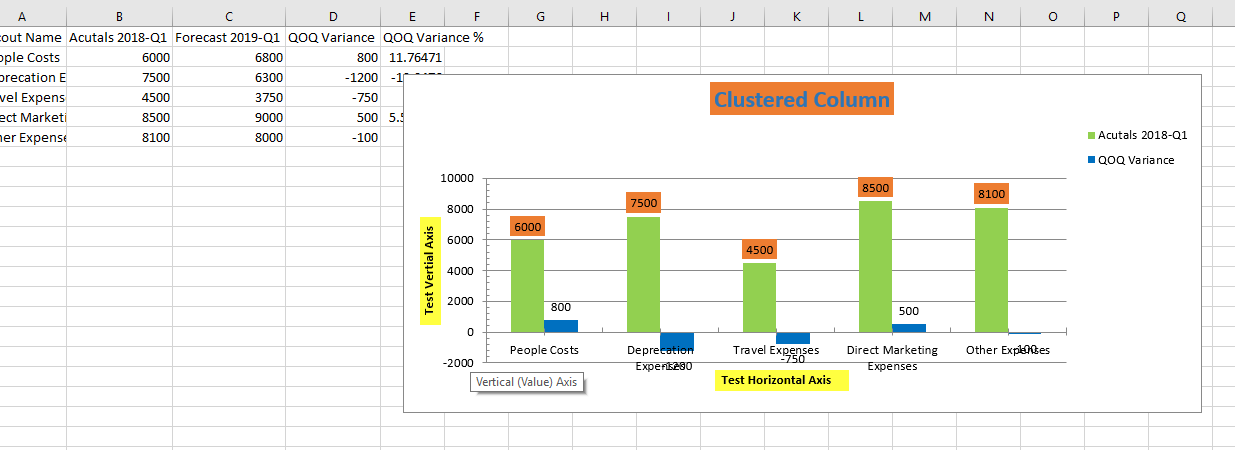
Please refer to the attached sample, where all the requirements you mentioned(gridlines, major/minor tick, axes titles etc.) are working fine.
Thanks,
Deepak SharmaSpreadJSCharts.zip