Posted 8 January 2024, 7:06 am EST - Updated 8 January 2024, 7:11 am EST
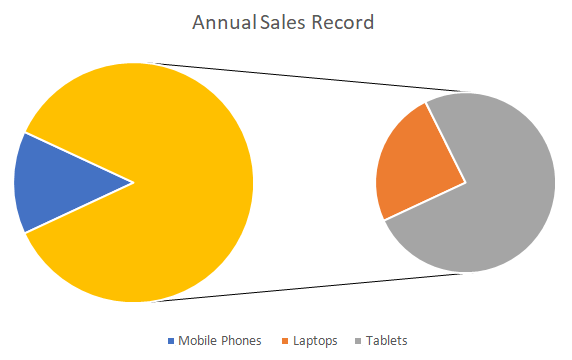
Is it possible to create a chart similar to the attached screenshot in RdlMultiSectionReports?
Forums Home / ActiveReports / General Discussion
Posted by: bnguyen on 8 January 2024, 7:06 am EST

bnguyen
Posted 8 January 2024, 7:06 am EST - Updated 8 January 2024, 7:11 am EST
Is it possible to create a chart similar to the attached screenshot in RdlMultiSectionReports?

akshay.rajput
![]()
Posted 8 January 2024, 6:27 pm EST
Hi Bryan,
It is not possible to create such a chart with ActiveReports you may however use data binding to filter charts and show them together. Please refer to the attached sample the chart controls in Container1 can work as a workaround if the values and categories don’t vary too much but has a potential to break. Where as the charts in the table is the Ideal way to go to for this use-case.


