Posted 11 August 2021, 12:50 am EST - Updated 30 September 2022, 4:17 am EST
Either SparklineAxisMinMax.Group is not working OR I’ve missed something in my configuration…
I’ve created sparklines for both rows in this table: 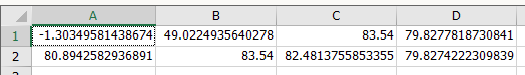
As you can see from the data, the range of row 1 should be ~-1.3 to 83.5 and row 2 is ~79.8 to 83.5
When I set both MinAxisType and MaxAxisType to SparklineAxisMinMax.Individual everything works as expected:
![]()
When I set the axis types to SparklineAxisMinMax.Custom and then set the ManualMin and ManualMax to -2 and 100 respectively I also get expected results:
![]()
However when I set to SparklineAxisMinMax.Group I get this:
![]()
I would have expected that my Group variant would have produced sparklines similar to my Manual method where row 2 has a much narrower range (flatter line) however it doesn’t seem to be calculating the range properly (or not applying it). Instead these look identical to the Individual case…
I have ensured that I’ve properly called SheetView.GroupSparkline() (as evidenced by the fact that the settings are applied properly when changing between Individual and Manual) and I’ve also ensured that I’m setting ManualMin and ManualMax to 0 in the case of both Group and Individual (not clear if this is necessary as the documentation is slightly vague).
Have I missed something in the configuration to get this working as expected or is this a bug?
I’m using Spread for WinForms v14.45.20201.0
Thanks!
Bill