Posted 19 October 2020, 12:04 am EST - Updated 3 October 2022, 1:08 am EST
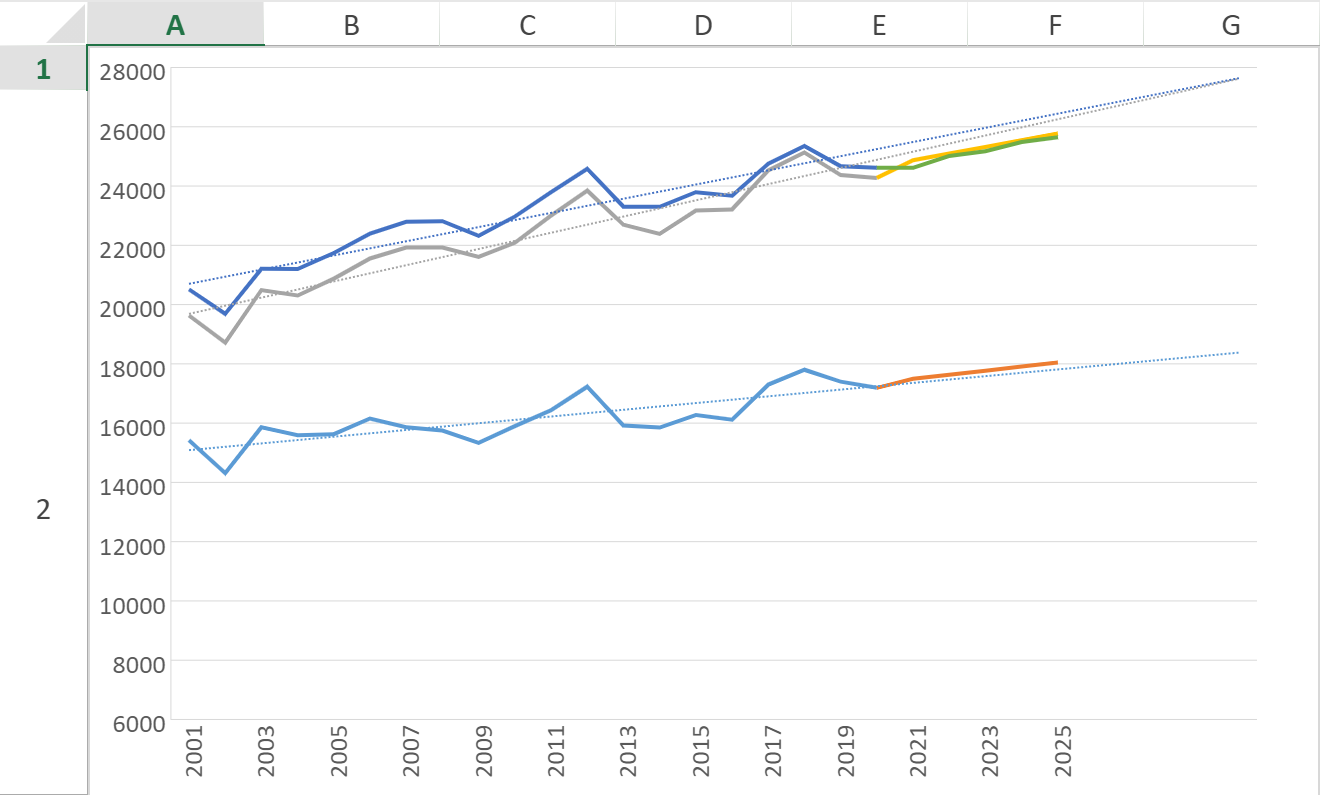
Values scaling on the chart axis
Posted by: marcin.kozlowski on 19 October 2020, 12:04 am EST
-

marcin.kozlowski
-

avinash.pathak

Posted 19 October 2020, 11:11 pm EST
Hi,
You may use axes.primaryValue.max and axes.primaryValue.min property for the required functionality. Please refer to the following code snippet and let us know if you face any issues.
var axes = chart.axes();
//define the max/min value for primary value axes
axes.primaryValue.max = 120;
axes.primaryValue.min = 10;

chart.axes(axes);
API references:
Regards
Avinash