Bar Chart - X-Axis selection

Posted by: chhavi.sethi on 14 October 2020, 1:25 am EST

  • Posted 14 October 2020, 1:25 am EST

    Hi,

    I was implementing a simple bar chart which was quite simple. But when it comes to customizing the chart it is a little hard to find a solution either on the forum and provided samples.

    So what I want to do with the bar chart(https://www.grapecity.com/wijmo/demos/Chart/Bar/BasicColumnChart/angular) is, when a user clicks on a country(at X-Axis) or the bars attached to a country, I want to operate another chart based on which country we select.

    I tried it using selectionMode=Point, but that does not select all three bars and a country. And I want to make that chart as stacked bars, so just make sure the solution you provide should work with stacked bars.

    I would appreciate if you can provide a fiddle.

    Thanks

  • Posted 14 October 2020, 6:26 pm EST

    Hi Chhavi,

    You can use the selectionChange event of the FlexChart to update the other chart. When a rect in the chart is clicked, only the current point is selected but the current item contains the complete item. So, you can use the CollectionView’s currentItem property to get the currently selected item.

    Now, to display all the rects as selected, you will need to handle the itemFormatter property of the chart and check whether the current series created is of the currently selected and then add the wj-state-selected class accordingly.

    Please refer to the sample link below for reference:

    https://stackblitz.com/edit/angular-ia9su9

    Regards,

    Ashwin

  • Posted 15 October 2020, 3:41 am EST - Updated 3 October 2022, 6:24 am EST

    Hi Ashwin,

    It works but has some issues.

    1. Performance Issue - the bars are getting selected one by one there was a gap of 500ms.
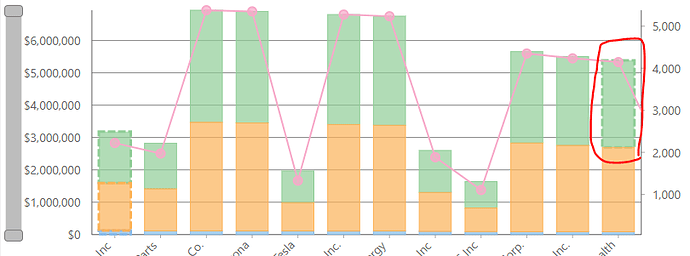
    2. Don’t know why the last bar got selected. Refer to attachment Capture.PNG
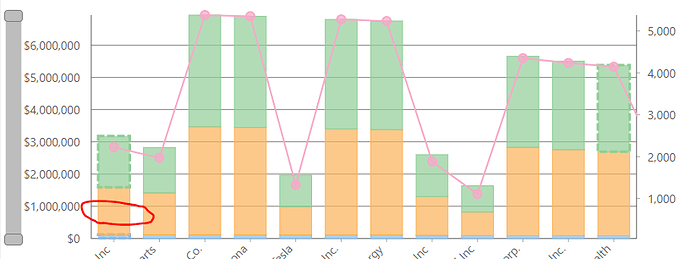
    3. When I click on Y-Axis labels, the selection changes as in Capture2.PNG

    So far It does not seem to be a proper solution, it was just a hack where we do DOM manipulation.

  • Posted 15 October 2020, 6:48 pm EST

    Hi Chhavi,

    Most of the solutions related to the chart need to manipulate the DOM. There are many scenarios that can be done in the chart but not all of them have a property, method, or any direct solution. Moreover, if we need to change the display of the chart, it is necessary to manipulate the DOM. Also, I have added an enhancement request for your requirement with the developers with internal tracking id 467192. I will update you once I will hear from them.

    Performance Issue - the bars are getting selected one by one there was a gap of 500ms.

    The chart will have performance issues because it needs to be refreshed in order to update the selected state of the rects. If we will not refresh the chart, the series formatter will not run and we will have no way to get the correct rect element to update the selection.

    Don’t know why the last bar got selected. Refer to attachment Capture.PNG

    This is because the formatter runs for the line chart also due to which it selects the last rect. I have updated the sample to check whether the current series is a column chart:

    https://stackblitz.com/edit/angular-ia9su9

    When I click on Y-Axis labels, the selection changes as in Capture2.PNG

    Sorry, but I was not able to replicate this issue at my end. Refer to the sample above which I used to replicate the issue. Can you modify the sample accordingly so that it reproduces the issue?

    ~regards

Need extra support?

Upgrade your support plan and get personal unlimited phone support with our customer engagement team

Learn More

Forum Channels