Posted 23 March 2021, 11:12 am EST - Updated 3 October 2022, 5:12 am EST
Hi
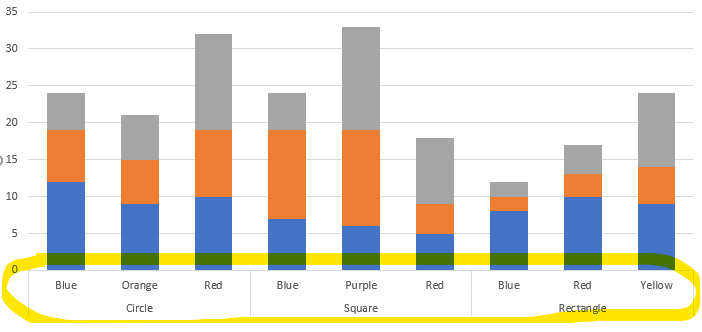
I was wondering if it is possible to do the type of chart attached using Wijmo FlexChart. It is stacked and has a grouped x axis. I managed to do it using Wijmo PivotChart and tried to analyse what was going on there but I’m wondering if there is an easy way to do it using FlexChart? I just can’t get a grouping from another field in the data on the x axis like this.
Thanks