FlexGrid: Apply custom aggregate logic to footer rows

Posted by: MichaelT on 28 November 2018, 4:44 am EST

    • Post Options:
    • Link

    Posted 28 November 2018, 4:44 am EST

    I have three (3) sets of combined records. Each combined record has three (3) sub-records. I want have custom aggregate logic for the three (3) sub-records that are grouped AND have custom logic in a footer for all three (3) combined records.

    For an example, we can use an automotive dealer.

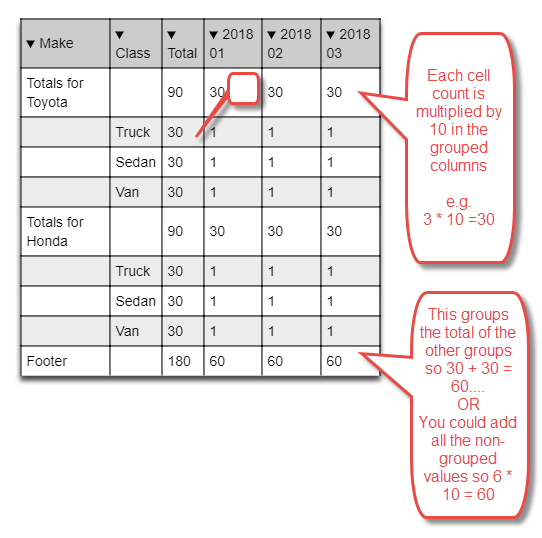
    Assume we are a car dealer who sells a certain number of different makes of vehicles (Toyota, Honda, etc.) and classes of vehicles (sedan, van, truck, etc.) each month. The dealer wants to see how many of each make of a vehicle is sold each month, so this needs to be an aggregate group. Then the dealer wants to see how many of each class of a vehicle is sold each month. This last column needs to be calculated in the footer of the grid.

    How can this be accomplished?

    I have attached a screenshot of what’s expected and a sample of the input code below.

    E.g.

    Input:

    [
        {
            "make": "Toyota",
            "class": "Truck",
            "2018 01": 1
        },
        {
            "make": "Toyota",
            "class": "Truck",
            "2018 02": 1
        },
        {
            "make": "Toyota",
            "class": "Truck",
            "2018 03": 1
        },
        {
            "make": "Toyota",
            "class": "Sedan",
            "2018 01": 1
        },
        {
            "make": "Toyota",
            "class": "Sedan",
            "2018 02": 1
        },
        {
            "make": "Toyota",
            "class": "Sedan",
            "2018 03": 1
        },
        {
            "make": "Toyota",
            "class": "Van",
            "2018 01": 1
        },
        {
            "make": "Toyota",
            "class": "Van",
            "2018 02": 1
        },
        {
            "make": "Toyota",
            "class": "Van",
            "2018 03": 1
        },
        {
            "make": "Honda",
            "class": "Truck",
            "2018 01": 1
        },
        {
            "make": "Honda",
            "class": "Truck",
            "2018 02": 1
        },
        {
            "make": "Honda",
            "class": "Truck",
            "2018 03": 1
        },
        {
            "make": "Honda",
            "class": "Sedan",
            "2018 01": 1
        },
        {
            "make": "Honda",
            "class": "Sedan",
            "2018 02": 1
        },
        {
            "make": "Honda",
            "class": "Sedan",
            "2018 03": 1
        },
        {
            "make": "Honda",
            "class": "Van",
            "2018 01": 1
        },
        {
            "make": "Honda",
            "class": "Van",
            "2018 02": 1
        },
        {
            "make": "Honda",
            "class": "Van",
            "2018 03": 1
        }
    ]
    
  • Posted 28 November 2018, 4:49 am EST - Updated 3 October 2022, 5:12 am EST

  • Posted 28 November 2018, 6:09 pm EST

    You may easily modify the aggregate value for display using cell templates.

    However grid works on flat data structure so first you need to transform your input data to the flat format supported by the grid like.

    var data= [
    	{
    		make: "a",
    		"class": "classA",
    		"2018 01": 1,
    		"2018 02": 1,
    		"2018 03": 1,
    	}
    	....
    ]
    

    Please refer to the following sample which demonstrates the same: https://stackblitz.com/edit/angular-1cyk9r?file=src%2Fapp%2Fapp.component.html

    ~Sharad

Need extra support?

Upgrade your support plan and get personal unlimited phone support with our customer engagement team

Learn More

Forum Channels