It is possible to change a Row grouping to a normal grid in a Transposed grid?

Posted by: jesan.gutierrez on 12 April 2024, 3:46 pm EST

  • Posted 12 April 2024, 3:46 pm EST - Updated 12 April 2024, 4:10 pm EST

    Hey hello wijmo team and developers arround, I’ve been using this library a couple of days and nothing to say but wow, it is a fantastic library I’m not going to lie; however, I’ve been asked to do crazy stuff and after spent several hours trying to achieve it I failed.

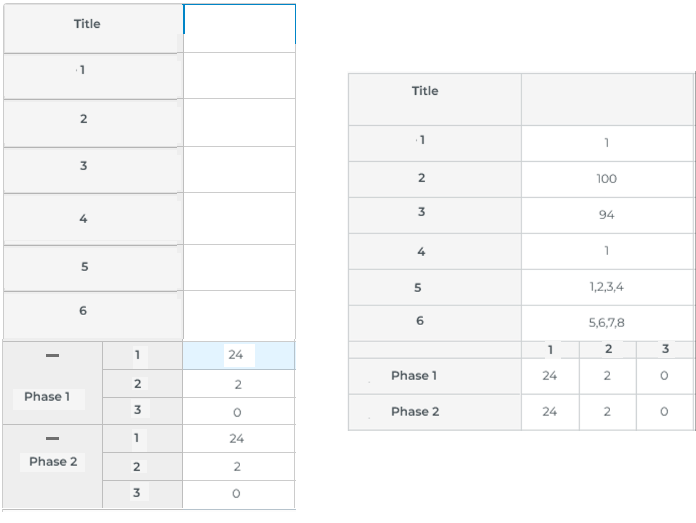
    The thing is I want to use the TransposedGrid > Row Grouping but instead of having the grouping vertical I want it horizontal (see the attachment).

    Any clue will be helpful, I also think it could be a good idea to combine a transposed grid with a regular grid

  • Posted 17 April 2024, 12:39 am EST

    Hi Jesan,

    Sorry for the delayed response, you can achieve the desired grid structure by using two different transposedGrids. You can sync the scrollbars for these grids by handling the ‘scrollPositionChanged’ event of the grids. You’ll need to make some modifications using CSS, to get the desired layout with two transposed grids.

    Please refer to the following sample for a demonstration - https://stackblitz.com/edit/js-18bgln?file=index.js

    You can follow a similar approach to create the grid layout as per your requirements. In case, you face any issues, please let us know. Also, please share some dummy data from your project, in that case, so that we can have a better understanding of your data structure and provide you with a solution accordingly. You can also modify the above sample to replicate the environment in your project and share it with us.

    Regards

  • Posted 17 April 2024, 5:57 am EST - Updated 17 April 2024, 6:03 am EST

    Hey thanks for the response, I saw the approach above and it’s pretty much what I need, I tried to modify the example, but I just can’t figure out where did you create the columns (1, 2, 3) for each phase.

    Since my grid will be editable, I’m converting the coord column to a checkbox and mode column will be a dropdown, I already check the documentation for that.

    This is an example of my json data by the way.

     
    const plans : any[] = [
            {
                "name": "My plan",
                "id": "23412",
                "planName": "this is my plan name",
                "number": 1,
                "cycle": 100,
                "offsetTime": 94,
                "splitNumber": 1,
                "sequenceNumber": 1,
                "Phases": [
                        {
                            "phaseNumber": 1,
                            "time": 24,
                            "mode": 2,
                            "coord": false
                        },
                        {
                            "phaseNumber": 2,
                            "time": 38,
                            "mode": 2,
                            "coord": false
                        },
                        {
                            "phaseNumber": 3,
                            "time": 23,
                            "mode": 2,
                            "coord": false
                        },
                        {
                            "phaseNumber": 4,
                            "time": 15,
                            "mode": 2,
                            "coord": false
                        },
                        {
                            "phaseNumber": 5,
                            "time": 17,
                            "mode": 2,
                            "coord": false
                        },
                        {
                            "phaseNumber": 6,
                            "time": 45,
                            "mode": 2,
                            "coord": true
                        },
                        {
                            "phaseNumber": 7,
                            "time": 14,
                            "mode": 2,
                            "coord": false
                        },
                        {
                            "phaseNumber": 8,
                            "time": 24,
                            "mode": 2,
                            "coord": false
                        }
                ]
            }
        ] 

  • Posted 18 April 2024, 4:53 pm EST

    Hi Jesan,

    Thank you for sharing the dummy data, the column names were assigned using the ‘formatItem’ event handler function in the sample we shared.

    As per the data structure you shared, it seems you’ll need to use the TransposedGrid for the upper Grid and a TransposedMultirow grid for the lower grid. You’ll also need to adjust the column sizes to match the sizes in both the grids. And the dummy data you shared could not be used as it is in the TransposedMultirow, so you’ll need to modify this data before assigning it to the grid, to get the desired output. Then you can handle the ‘formatItem’ event of the grid to display the required names in rowHeaders and columnHeaders.

    Please refer to the following updated sample for the same - https://stackblitz.com/edit/js-j7k2ee?file=index.js

    Please note that, as you’ll be keeping the grids editable, you’ll need to manage the edited data separately for each grid, if you want to save it somewhere in your database. You can also create a custom function to recombine the data from both grids, just like we created a function to extract phase data in the above sample.

    Regards

Need extra support?

Upgrade your support plan and get personal unlimited phone support with our customer engagement team

Learn More

Forum Channels