Posted 10 August 2022, 11:38 pm EST - Updated 3 October 2022, 2:48 am EST
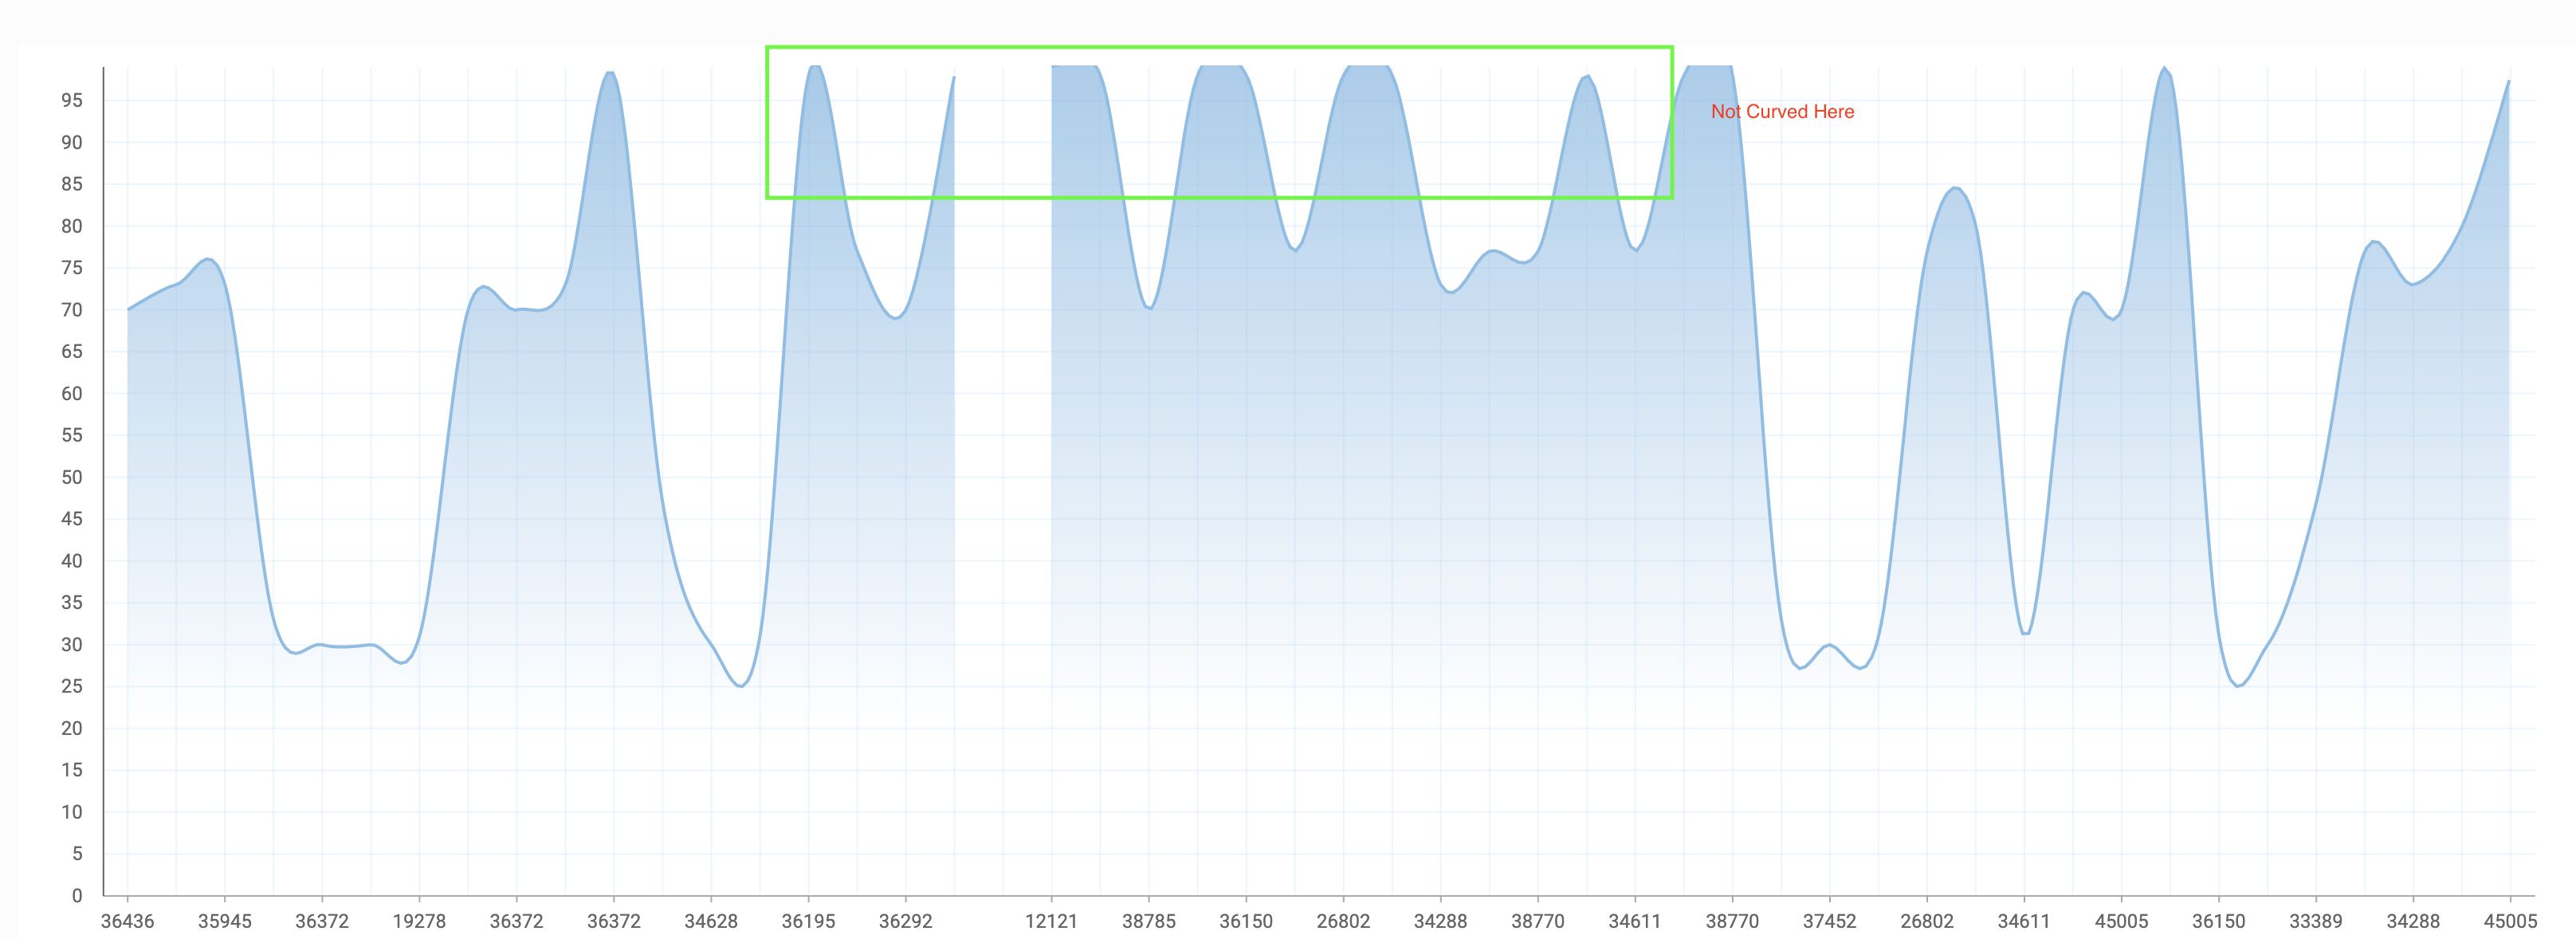
Spline Chart is not curved at top
Posted by: sskss1ss2 on 10 August 2022, 11:38 pm EST
-

sskss1ss2
-

sonu.pandey

Posted 11 August 2022, 6:24 pm EST
Hello,
As per the shared image, it seems that the values of some of the data points are exceeding the max point of the Y-axis, therefore the curves seem to be cut off. To resolve the issue you mat to set the max property value of axisY to a higher number. You can refer to the sample link below for reference:
https://stackblitz.com/edit/js-f97uju?file=index.js
API link: https://www.grapecity.com/wijmo/api/classes/wijmo_chart.axis.html#max
In case the issue still persists please share a small sample replicating the issue. So that we can investigate further and assist you accordingly.
Regards