Posted 27 September 2023, 5:42 pm EST - Updated 27 September 2023, 5:47 pm EST
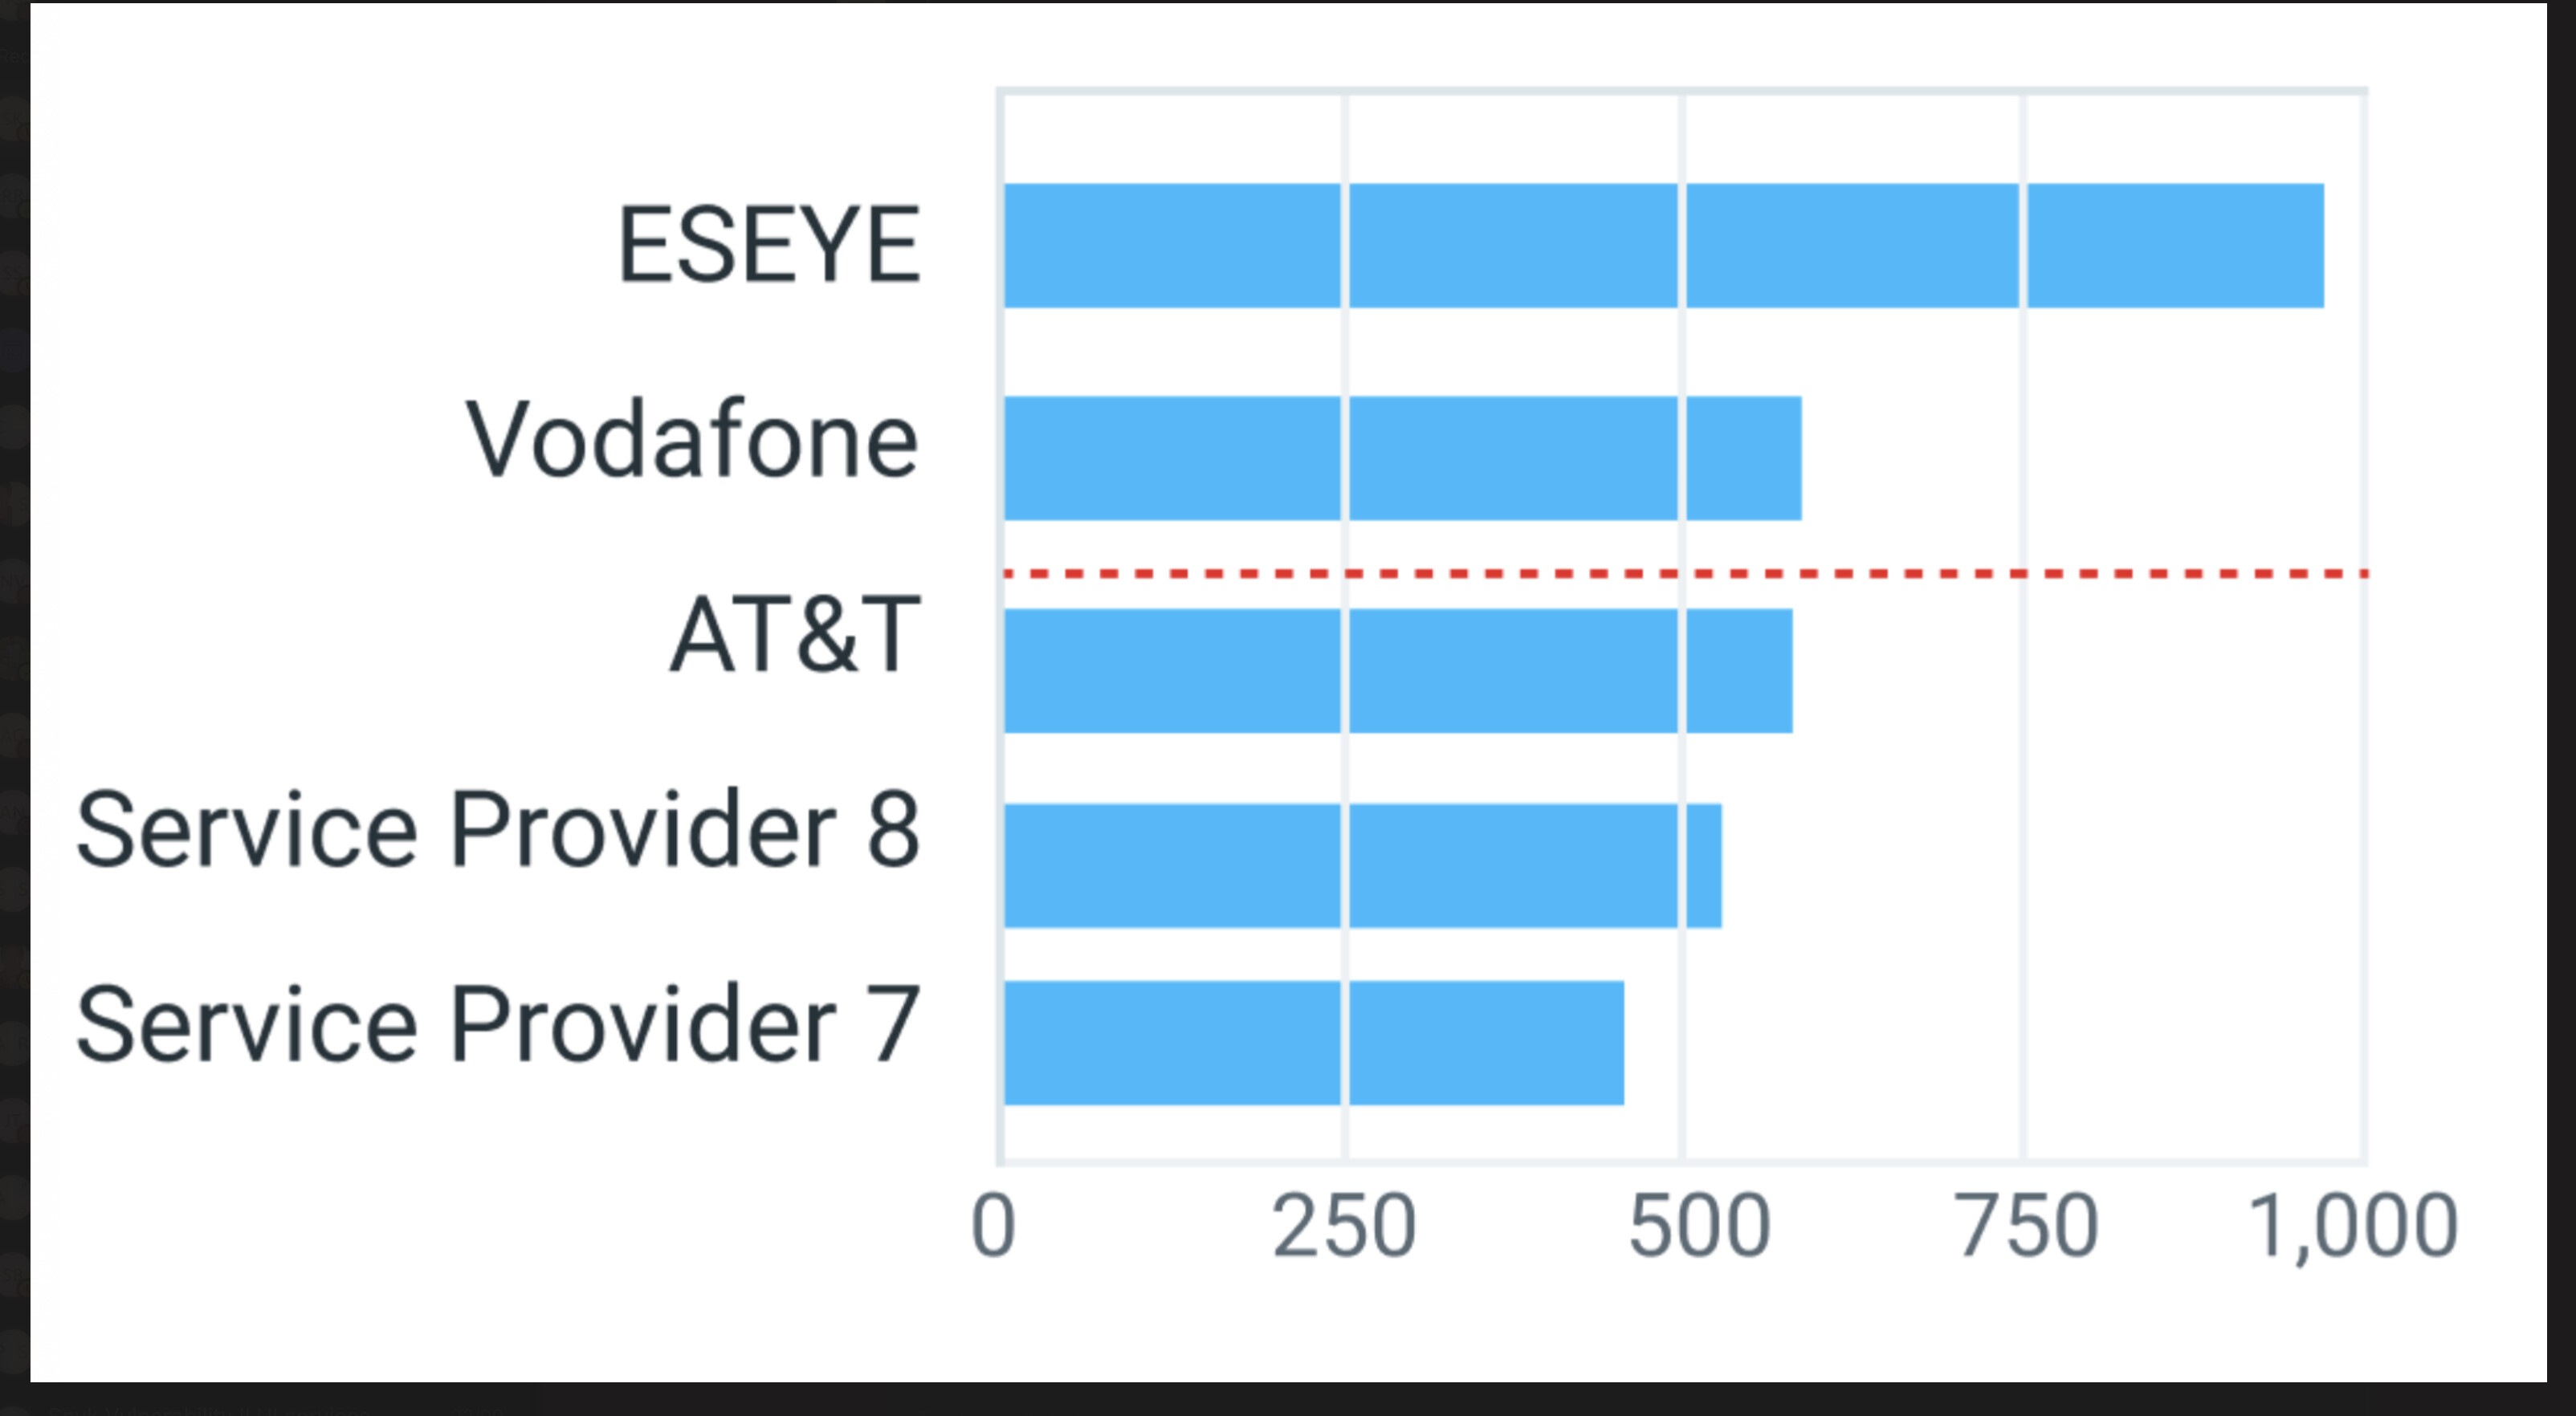
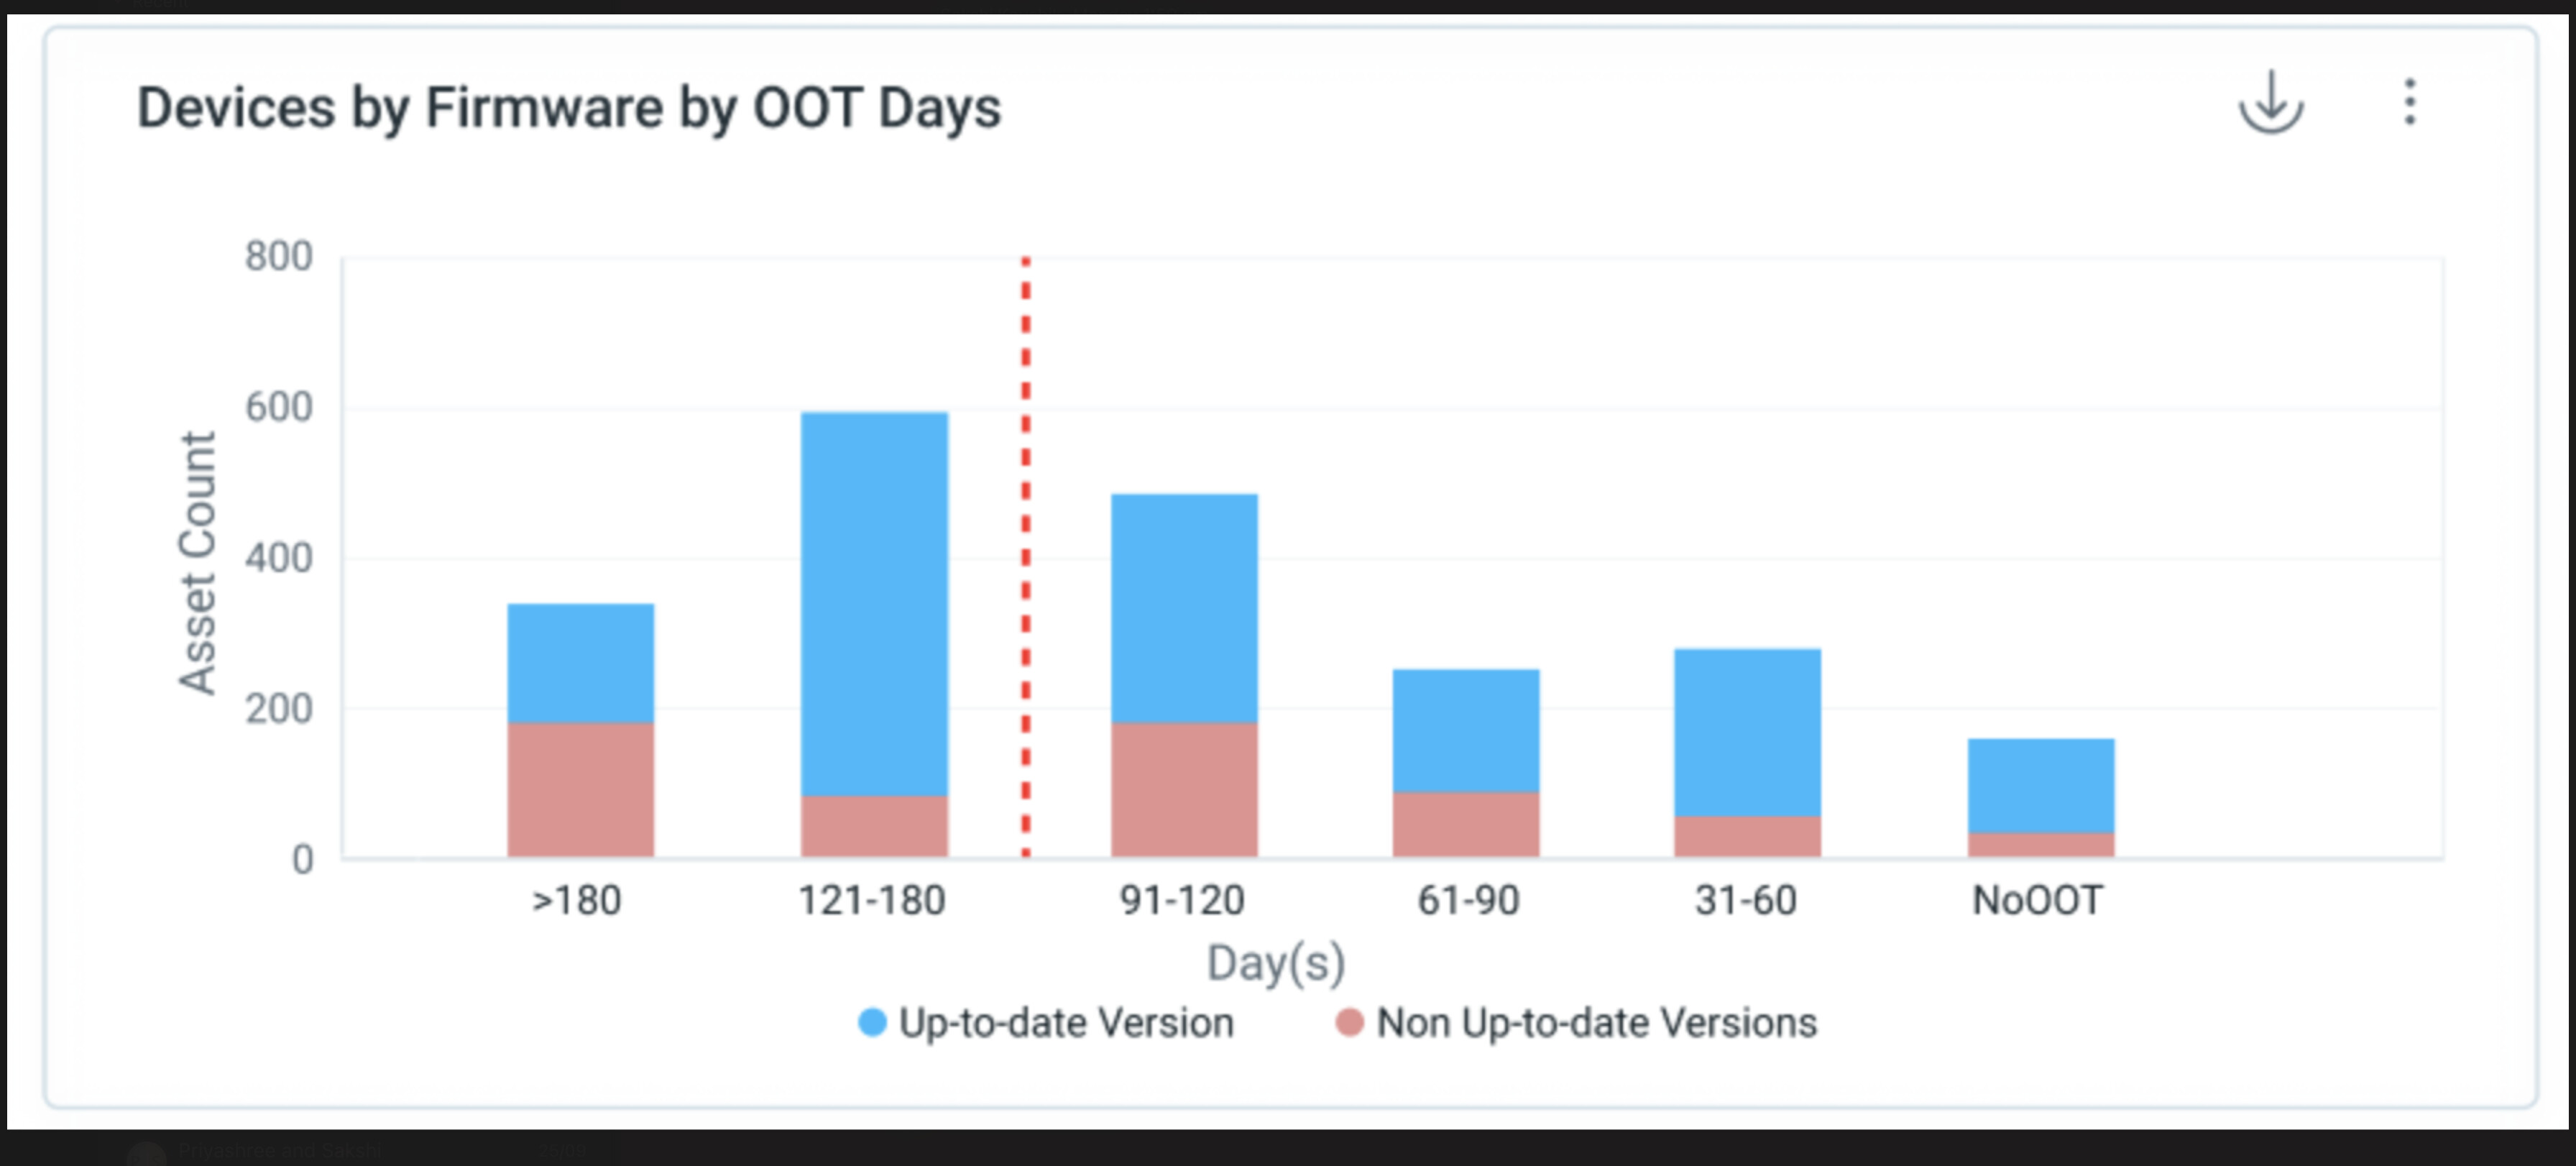
Threshold line in Charts
Posted by: vinaybietpratap on 27 September 2023, 5:42 pm EST
-

vinaybietpratap
-

anirudh.verma

Posted 28 September 2023, 4:22 pm EST
Hi,
You can use the AnnotationLayer class to place a line and configure it according to the requirement.
Please refer to these API references for more information:
- AnnotationLayer Class: https://www.grapecity.com/wijmo/api/classes/wijmo_chart_annotation.annotationlayer.html
- Line Class: https://www.grapecity.com/wijmo/api/classes/wijmo_chart_annotation.line.html#seriesindex
Please refer to this sample for reference: https://jscodemine.grapecity.com/share/cNCieFdD2UOnG2onfn9fXQ
Regards
Anirudh