Posted 22 June 2023, 4:19 am EST - Updated 22 June 2023, 4:24 am EST
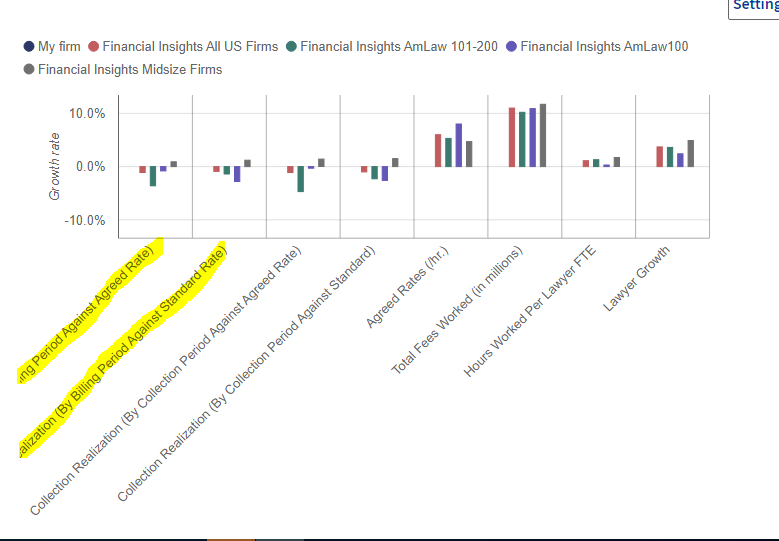
Wijmo chart x axis label name getting trimed
Posted by: vidhi.shah on 22 June 2023, 4:19 am EST
-

vidhi.shah
-

manish.gupta

Posted 24 June 2023, 2:19 pm EST
Hi,
To show the full labels we have to customize the axis labels. We may do so by either of the following two approaches:Trim the text manually and show tooltip when the user hover over the axis label.
Please refer to this sample for reference: https://stackblitz.com/edit/js-xkmzw9Add line breaks to the text which is to be shown on the axis and then wrap the labels accordingly by handling rendered event of FlexChart.
Please refer to this sample for reference: https://stackblitz.com/edit/js-jtkv4y
Regards,
Manish Gupta -
vidhi.shah
Posted 24 June 2023, 3:29 pm EST
Hi Manish Gupta,
Thanks for the help ,
The second solution Add line breaks to the text which is to be shown on the axis and then wrap the labels accordingly by handling rendered event of FlexChart. is not working for me as my graph is dynamic user can add or remove property of axis X,
Though first solution works Trim the text manually and show tooltip when the user hover over the axis label. but now i need to download the chart in JPEG and PNG format accordingly so in that i need to show the full name. so how can i achieve that ?
Regards ,
Vidhi Shah -
manish.gupta
Posted 26 June 2023, 2:07 am EST
Hi,
If the requirement is to save the chart image, then we may use the line break solution instead of the tooltip solution but without explicitly defining line breaks in the data. Since, the x axis labels can be removed/added dynamically so, we may dynamically add line breaks to the axis labels in the handler of the rendered event of FlexChart. This will also allow us to save the Image with full axis labels.
The tooltip solution will not be feasible in case the image of the chart is to be stored. This is because to show full axis labels we have to show them on the chart and for this we have to add line breaks to the axis labels to wrap the text. This will then need us to mix two approaches for the same requirement. Because initially we are displaying tooltip, then at the time of Exporting the chart to image, we have to add line breaks to the axis labels. Then after exporting the image we have to reset the axis labels(remove the line breaks) to show the tooltip.
Please refer to this sample for reference: https://stackblitz.com/edit/js-nlvmbhRegards,
Manish Gupta -
manish.gupta
Posted 29 June 2023, 3:15 pm EST
Hi,
We have updated the sample to align the axis labels as per the series and independent of axis labels length.
Please refer to this sample for reference: https://stackblitz.com/edit/js-bilzazRegards,
Manish Gupta