Wijmo Flex Chart Description/ Alt Text

Posted by: sumita.sharma on 21 February 2024, 10:43 am EST

  • Posted 21 February 2024, 10:43 am EST - Updated 21 February 2024, 10:48 am EST

    Hi Team,

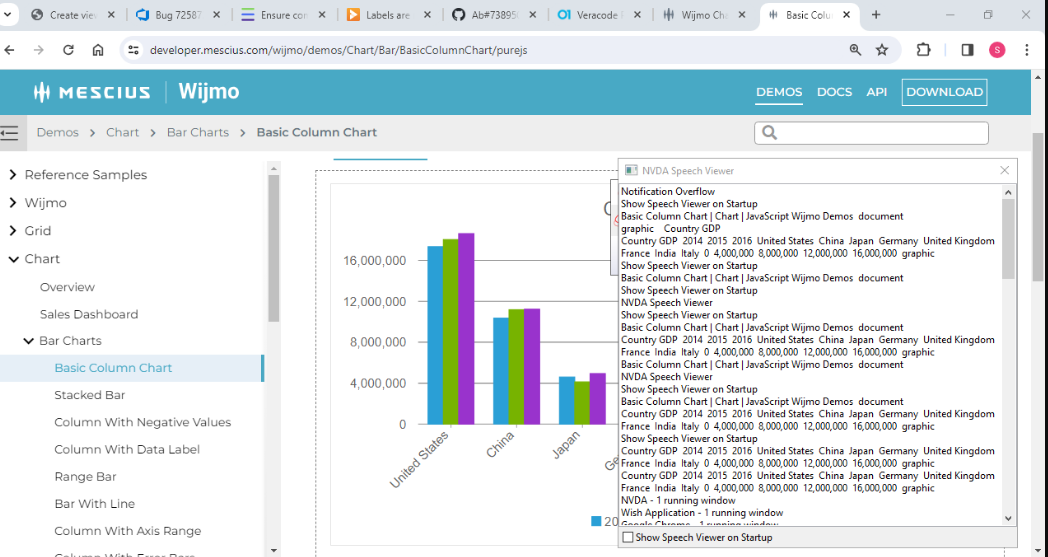
    We are using Angular 15 and Wijmo 5.20231. During our accessibility testing for the Wijmo flex chart, the tester said “To convey data or detailed information, the text alternative must be a full-text equivalent of the data or information provided in the image through text on page or appropriate use of aria attributes”. Currently, I can see for eg . Wijmo column Chart on the demo website (https://developer.mescius.com/wijmo/demos/Chart/Bar/BasicColumnChart/purejs) I have attached the image and NVDA speech as well, you can see the data values have not announced the legends and all are announced but not values bars are representing. Below are the questions

    1. Is there any way to have the values announced?
    2. If not, is there any way I can add alt text or similar to the SVG which has the chart

  • Posted 21 February 2024, 9:53 pm EST

    Hi Sumita,

    As per our understanding, you want the NVDA to announce the values corresponding the bars. By default, there is no such functionality available for charts. However, you may set values to each bar by handling the rendered event. In the handler, please set the aria-label attribute to each rect element.

    This requirement is already answered on another forum case. Please refer to this case for reference: https://developer.mescius.com/forums/wijmo/keyboard-navigation-for-wijmo-chart#73620

    In case, if I missed something then please let me know.

    Thank you.

    Regards

  • Posted 23 February 2024, 2:13 am EST

    Hi Anirudh ,

    Git it but is there any other way where we can add some altText or description for the SVG?

    Regards,

    Sumita Sharma

  • Posted 25 February 2024, 8:29 pm EST

    Hi,

    Sorry for the inconvenience caused. As per my understanding, you want to add a description for the whole SVG instead of setting labels to each child SVG elements. So, as suggested previously, you may handle the rendered event for adding additional appropriate ARIA attributes to any of the chart element.

    In case, if you have already added the labels for the bars, then adding the description for the whole SVG might confuse the user with excess information.

    Regarding any other method of adding ARIA attributes, if you want to add ARIA attribute to the hostElement of the chart, then you may add it using the initialized event. However, if the requirement is to set the ARIA attributes to the internal chart elements like bars series, labels, etc then you need to handle the rendered event as the added attributes will not be preserved when these elements are rendered again due to any layout change.

    Hope it helps. Thank you.

    Regards

Need extra support?

Upgrade your support plan and get personal unlimited phone support with our customer engagement team

Learn More

Forum Channels