Posted 25 May 2021, 1:06 pm EST - Updated 3 October 2022, 2:11 pm EST
About AxisX.TickLabels of c1 chart
Posted by: toynnus on 25 May 2021, 1:06 pm EST
-

toynnus
-

kartik.sagar

Posted 25 May 2021, 4:04 pm EST
Hi Sungtae,
Thank you for sharing the snapshot.
You can display required labels for AxisX by using Axis’s DataSource and Binding property as follows:
private void InitAxisXDataSource()
{
        flexChart.AxisX.DataSource = new List<AxisLabel>()
        {
              new AxisLabel() { Time = new DateTime(2021, 1, 1, 2, 0, 0), Text = "02:00" },
              new AxisLabel() { Time = new DateTime(2021, 1, 1, 5, 0, 0), Text = "05:00" },
              new AxisLabel() { Time = new DateTime(2021, 1, 1, 8, 0, 0), Text = "08:00" },
         };

         flexChart.AxisX.Binding = "Time,Text";
}
And in order to allow plotting of only the corresponding data points you can use Series’s SymbolRendering event as follows:
public int[] _allowedHours = new int[] { 2, 5, 8 };

private void OnSymbolRendering(object sender, RenderSymbolEventArgs e)
{
         var dataItem = e.Item as DataItem;

         if (!_allowedHours.Any(x => dataItem.Time.Hour == x))
         {
               e.Cancel = true; // cancels plotting of a point
         }
}
Please refer to the same from the attached sample. (see FlexChartAxis.zip)
Best Regards,
Kartik -
toynnus
Posted 26 May 2021, 5:32 pm EST
thank you. Can I get it as vb.net code?
-
kartik.sagar
Posted 26 May 2021, 5:35 pm EST
Hi Sungtae,
I have attached the sample in VB. (see FlexChartAxis_VB.zip)
Best Regards,
Kartik -
toynnus
Posted 26 May 2021, 6:06 pm EST
Thank you.
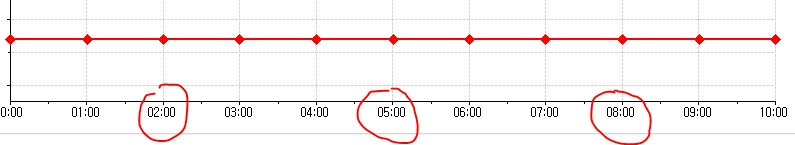
But that method doesn’t work for me.
Charts with too many data,
such as the attached image, should be displayed intermittently.carea.AxisX.TickLabels = TickLabelsEnum.Low
-
kartik.sagar
Posted 26 May 2021, 7:59 pm EST
Hi Sungtae,
Thank you for sharing the snapshot.
We are sorry but FlexChart doesn’t supports displaying irregular intervals. However, as per your requirement you can filter out the data and then reset FlexChart’s DataSource to display the filtered data. But still the axis labels will be displayed with regular intervals.
Just in case needed you may also use AxisScrollbar for scrolling large amount of data. For example, you can add AxisScrollbar for AxisX as follows:
Dim hScroll = New AxisScrollbar(flexChart.AxisX)And also in order to prevent the axis labels overlapping you can set Axis’s OverlappingLabels propery to Auto as follows:
flexChart.AxisX.OverlappingLabels = OverlappingLabels.AutoPlease refer to the same from the attached sample. (see FlexChartAxis_Mod.zip)
Best Regards
Kartik -
toynnus
Posted 27 May 2021, 12:51 pm EST
thank you. but I’m using old c1chart, not flexchart.
Can I use OverlappingLabels in C1Chart? -
kartik.sagar
Posted 27 May 2021, 3:03 pm EST
Hi Sungtae,
I apologize for the misunderstanding.
In order to prevent overlapping labels in C1Chart you may set the ChartArea.AxisX’s NoAnnoOverlap property to true as follows:
C1Chart1.ChartArea.AxisX.NoAnnoOverlap = TrueJFYI, setting NoAnnoOverlap property is not required if ChartArea.AxisX’s AutoMajor property is set to true as follows:
C1Chart1.ChartArea.AxisX.AutoMajor = TrueI hope it helped.
Best Regards,
Kartik -
toynnus
Posted 27 May 2021, 3:14 pm EST
This is the answer I wanted. It works fine. Thank you very much.