Posted 14 December 2023, 3:23 pm EST - Updated 14 December 2023, 3:29 pm EST
FlexChart Binding object issue
Posted by: dung.itcdt on 14 December 2023, 3:23 pm EST
-

dung.itcdt
-

uttkarsh.matiyal

Posted 18 December 2023, 2:23 pm EST
Hello dung,
We apologize for the delay in response over the weekend.
Thank you for bringing this matter to our attention. We are discussing this behavior with the development team and will let you know as soon as we get any updates.
However, until then, you can modify your data before passing it to the dataSource. Please refer to the attached stripped-down sample for implementation. (see FlexChart48_ColumnTypeObject.zip)
Internal tracking ID: C1WIN-31494
Regards,
Uttkarsh. -
uttkarsh.matiyal
Posted 20 December 2023, 2:56 pm EST
Hello dung,
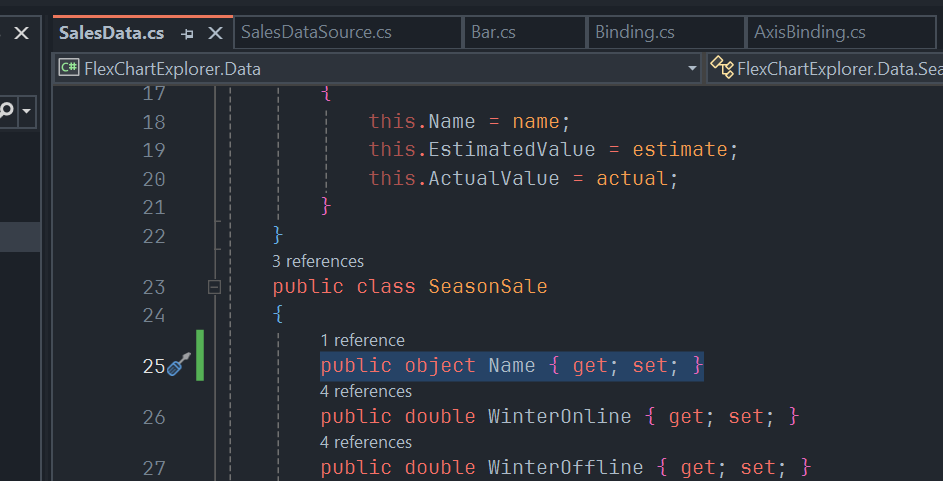
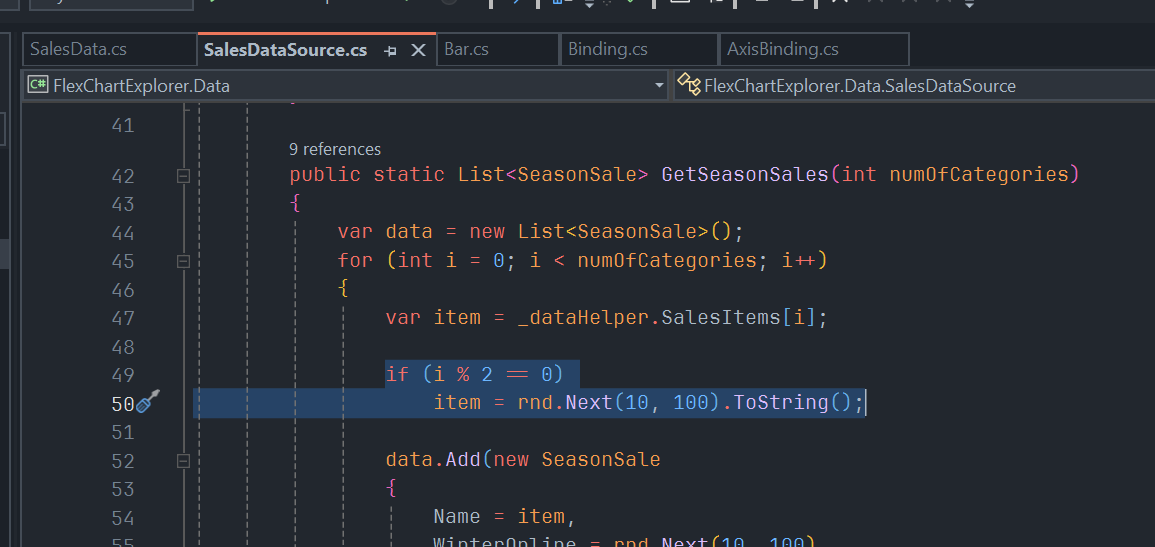
As per the developers, mixing string and numeric types is a non-standard situation, and the chart is getting confused by that. So they suggested a workaround for this by adding a property to the data class that converts x-data to a string and using this property as BindingX (chart.BindingX = “XString”).
public class SampleData
{
    public object X { get; set; }
    public string XString => X.ToString();
    . . .
}
This would give a clear indication that X values should be treated as strings.
Please refer to the attached modified sample. (see FlexChart48_ColumnTypeObject_Mod.zip)If this does not fit into your use case, could you please share your use case (how you are implementing DataSource) so that we could suggest the best way to implement this?
Regards,
Uttkarsh.