Posted 21 October 2019, 7:50 am EST - Updated 4 October 2022, 12:03 am EST
I am working on taking some graphs made in excel with Pivot Tables and converting them into a C# WPF application where we will have more control over the data. I have gotten most of our graphs over pretty well and just have a couple of quirky ones left that I hope someone could help point me in the right direction.
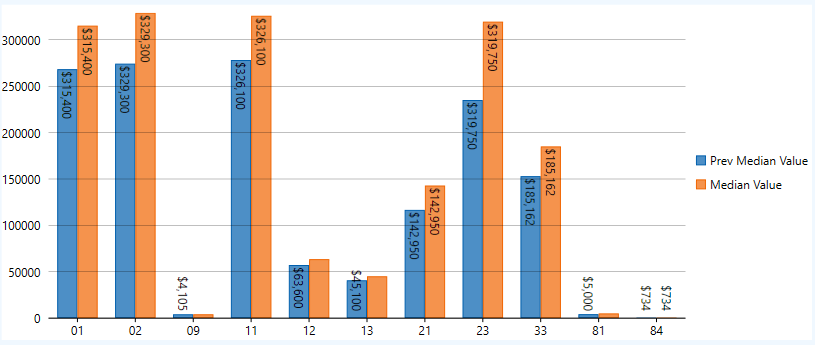
- I have a graph that displays the median value by a grouping on a bar chart. I have the chart displaying properly with the bars ascending vertically and I have placed the DataLabels showing up overlayed over the bar. What I want to happen is for those DataLabels to have a minimum position above the X axis so that they shift up off of the LabelPosition if they would end up over the axis but to otherwise position with LabelPosition.Bottom.
-
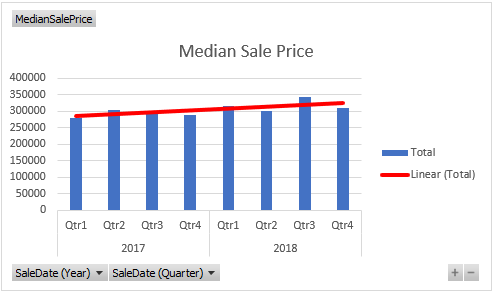 I have a graph with multiple x axis groupings and I am wondering if this is possible and if so if there is a sample. This graph shows median sale price by quarter and then I want the quarters grouped by year.
Thanks for pointing me in the right direction with these graphs. I think I have everything else I need at this time figured out, this software really was pretty intuitive once I got the initial table showing up.