C1FlexChart - How can we show the Axis in the middle of the chart

Posted by: digiptechnologies on 19 June 2019, 12:36 am EST

    • Post Options:
    • Link

    Posted 19 June 2019, 12:36 am EST - Updated 4 October 2022, 12:05 am EST

    Hello,

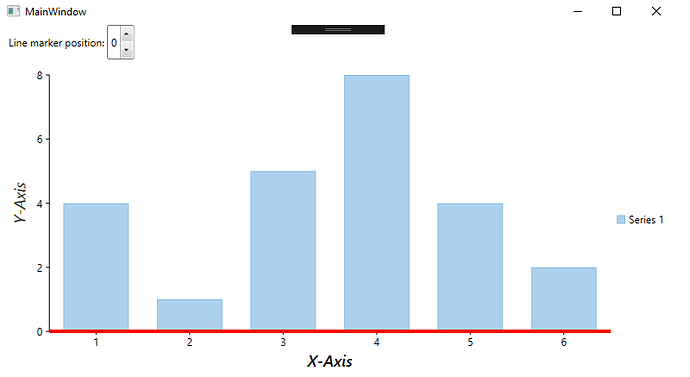
    We have a requirement where we need to show an axis or line in between chart. So if you can look into the attached image, there is a red line, we need to show some kind of a line there so the end user can easily understand the data.

    Please let me know how can we achieve that?

    Thanks,

    Parthiv

  • Posted 19 June 2019, 8:45 pm EST

    Hi Parthiv,

    What you basically need here is a static LineMarker.

    To use it, just add LineMarker to FlexChart’s Layers collection and set following few properties as follows:```

    c1:C1FlexChart.Layers

    <c1:C1LineMarker x:Name=“lineMarker” Interaction=“None” VerticalPosition=“1” Lines=“Horizontal” LineWidth=“4” LineBrush=“Red”/>

    </c1:C1FlexChart.Layers>

    
    Thanks,
    Ruchir
  • Posted 20 June 2019, 12:24 am EST

    Hello Ruchir,

    Thanks for the response. Though can you tell me how do we get the point for a give data ? for example, we need to set the line marker at the point where we have “0” data point on the y-axis. Can you guide me how can we set the line at a particular data point?

    Thanks,

    Parthiv

  • Posted 20 June 2019, 5:00 pm EST

    Hello Parthiv,

    You can get the point of any data by handling the SymbolRendered event that are specific to Series.

    So to meet your requirement, just handle the SymbolRendered event for your series and inside modify the LineMarker position, as follows:```

    private void MainWindow_SymbolRendered(object sender, RenderSymbolEventArgs e)

    {

    var yData = ((Point)e.Item).Y;

    if(yData == 8)

    {

    var yScale = e.Point.Y/ Math.Ceiling(flexChart.PlotRect.Height);

    lineMarker.VerticalPosition = yScale;

    }

    }

    Ruchir
  • Posted 24 June 2019, 9:28 pm EST

    Hello Ruchir,

    Thanks for the response. Actually, I realized, I need to put the LineMarker at a particular Y-Axis label. So in the case of the above example, we need to put the line marker at a position where Y-axis label value is “0”.

    Could you please let me know how can we achieve this or any event you can suggest which we can evaluate to achieve this?

    Thanks,

    Parthiv

  • Posted 25 June 2019, 6:19 pm EST - Updated 4 October 2022, 12:05 am EST

    Hi Parthiv,

    LineMarker is placed relative to the plot area that is, the acceptable range for its VerticalPosition property is [0,1].

    So, when LineMarker is placed at y-axis value “0” its VerticalPosition equals 1 and at the maximum y-axis value VerticalPosition equals 0. For all the other values that lie in between Min and Max values, you need to get that value’s relative position.

    I have prepared a solution and attached here for your reference. Following is its output.

    Hope that helps.

    Best wishes,

    Ruchir

    LineMarker_FlexChart.zip

  • Posted 7 July 2019, 11:03 pm EST

    Hello Ruchir,

    Thanks for the demo, it works great. But when I load different series data runtime, sometimes the line marker is not set to the exact point we want. Can you tell me reason for that.

    Also, I realized the zoom in/out also distracting the set line marker position. Could you please tell me how to fix this.

    Thanks,

    Parthiv

  • Posted 9 July 2019, 1:59 am EST

    Hello Parthiv,

    When zooming in/out the Min,Max Axis-Y values changes. And since we used these values to calculate LineMarker’s VerticalPosition, they need to be re-calculated.

    For this, you should keep the zooming flag true till SymbolRendered event and use this event to recalculate min, max Axis-Y values and then turn false the zooming flag.

    Thanks,

    Ruchir

Need extra support?

Upgrade your support plan and get personal unlimited phone support with our customer engagement team

Learn More

Forum Channels