| Quick Start Guide | |
|---|---|
| What You Will Need | React, Node, Wijmo, NPM |
| Controls Referenced | |
| Tutorial Concept | Building a React Weather App - Build a custom weather application using React, OpenWeatherMap API, and Wijmo gauge components. |
In this blog, we will create a React function-based component application that fetches weather information from the OpenWeatherMap API and displays it using Wijmo components, mainly focusing on Wijmo gauges.
Wijmo gauge components offer a robust and versatile solution for companies looking to enhance their visualization capabilities within applications. These components provide a wide range of customizable and interactive gauge types, such as radial, linear, and more, allowing developers to effectively convey complex data in a visually compelling manner in a short amount of time.

Prerequisites:
- Node.js installed on your machine
- Basic knowledge of React
- OpenWeatherMap API key (sign up here to get your API key).
- Basic knowledge of HTML, CSS/Bootstrap, and JavaScript
If you would like to reference the example code at any time, it can be found here.
Ready to Try It Out? Download Wijmo Today!
Step 1: Set Up Your React App
npx create-react-app weather-app
cd weather-app
Step 2: Install Packages
npm install @grapecity/wijmo.react.allnpm install bootstrapStep 3: Get the OpenWeatherMap API Key
Visit OpenWeatherMap and sign up to get your API key. Just fill out your form, and you're good to go!

Step 4: Create a Weather Component
We will use OpenWeather's 5-day weather forecast API for this app. You can find the documentation for the API here.
Create a new file called WeatherComponent.js in the src folder and add this code:
import React, { useState, useEffect } from "react";
import * as wjGauge from "@grapecity/wijmo.react.gauge";
import "@grapecity/wijmo.styles/wijmo.css";
import "./App.css";
import "bootstrap/dist/css/bootstrap.css";

const WeatherComponent = () => {
  const [weatherData, setWeatherData] = useState(null);
  const apiKey = "YOUR API KEY";
  const city = "Your City";

  useEffect(() => {
    const fetchWeatherData = async () => {
      try {
        const response = await fetch(
          `https://api.openweathermap.org/data/2.5/forecast?q=${city}&units=imperial&appid=${apiKey}`
        );
        const data = await response.json();
        setWeatherData(data);
      } catch (error) {
        console.error("Error fetching weather data:", error);
      }
    };

    fetchWeatherData();
  }, [city, apiKey]);

 return ();
};

export default WeatherComponent;
Step 5: Integrate WeatherComponent into App
Open src/App.js and replace its content with this code:
import React from "react";
import WeatherComponent from "./WeatherComponent";

function App() {
  return (
    <div className="App">
      <header className="App-header">
        <h1>Weather App</h1>
      </header>
      <main>
        <WeatherComponent />
      </main>
    </div>
  );
}

export default App;
Step 6: Adding Our First Wijmo Gauge and Styling
Now that we are requesting OpenWeatherMap and getting our data, let's put it in a Wijmo gauge. In your WeatherComponent.js, we will start by adding a Wijmo Radial Gauge. To do this, we add this code inside return():
<div>
      {weatherData && (
        <>
          <div className="container-fluid">
            <div className="text-center">
              <h2>Current Weather</h2>
            </div>

            <div>
              <wjGauge.RadialGauge
                min={-60}
                max={120}
                value={weatherData.list[0].main.temp}
                autoScale={false}
                thickness={0.2}
                showText={ShowText.Value}
                startAngle={-45}
                sweepAngle={270}
                showTicks={true}
                showTickText={true}
                tickSpacing={20}
                isReadOnly={true}
                showRanges={true}
                needleLength={"Inner"}
                needleElement={rg.createNeedleElement([
                  { x: 40, y: 15 },
                  { x: 90, y: 0 },
                ])}
              >
                <wjGauge.Range wjProperty="pointer" thickness={0} />
                <wjGauge.Range min={-60} max={-40} color="MidnightBlue" />
                <wjGauge.Range min={-40} max={-20} color="DarkBlue" />
                <wjGauge.Range min={-20} max={20} color="LightBlue" />
                <wjGauge.Range min={20} max={40} color="Gold" />
                <wjGauge.Range min={40} max={80} color="GoldenRod" />
                <wjGauge.Range min={80} max={100} color="FireBrick" />
                <wjGauge.Range min={100} max={120} color="DarkRed" />
              </wjGauge.RadialGauge>
            </div>
          </div>
        </>
      )}
    </div>
Wijmo's gauges are heavily customizable; you can style them however you'd like! For this example, we added ranges to depict the weather temperature. We are adding a lot of functionality quickly and without difficulty in the component properties.
The key properties are min, max, and value. These properties control the range of values for the gauge. Some of the other properties, such as autoScale, are not as self-explanatory. This property determines whether the gauge will automatically adjust its size in your app. The thickness property controls the thickness of the gauge itself. Another property worth mentioning is showRanges. This property enables the ranges inside the gauge to be shown. Without this property set to true, all the colors in the range are not shown. Some properties are specific to the radial gauge, such as the needleLength and needleElement. These determine the look of the needle pointer on the gauge and can be tweaked to fit your needs. To see more info on properties, click here.
Next, we'll add some basic styling for our app. Please add this code to your App.css file:
h2 {
  text-align: center;
}

.App-header {
  text-align: center;
  margin-bottom: 1rem;
}

.weekly-temperature {
  .wj-lineargauge {
    height: 300px;
    width: 2em;
  }
}

.gauge-holder {
  box-shadow: 0 3px 6px rgba(0, 0, 0, 0.16), 0 3px 6px rgba(0, 0, 0, 0.23);
  border-radius: 25px;
}

.iconImg {
  height: 100px;
  width: 100px;
}

.header-background {
  background-color: #2f7e95;
}

.future-weather-background {
  background-color: #e9e9e9;
  border-radius: 25px;

  p {
    font-size: 12px;
  }
}
Step 7: Run Your App
npm run startVisit http://localhost:3000 in your browser to see your weather app in action. It should look something like this:
Your app should be functional and look like this, and it only took a few minutes:

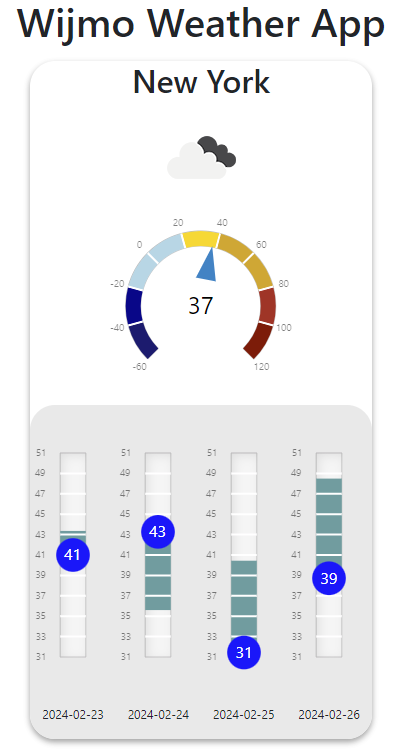
Step 8: Adding More Gauges and Features
Wijmo has more than just one type of gauge; it also comes equipped with Linear and Bullet Graph type gauges for whatever use case you may have! For our example, let's add some Linear gauges to depict the coming days' temperatures as well as their highs and lows. To do this, we will have to alter our styling and add some RadialGauge components. Replace your code with this snippet:
<div>
      {weatherData && (
        <>
          <div className="container-fluid d-flex justify-content-center">
            <div className="d-flex flex-column gauge-holder">
              <div className="text-center">
                <h2>{city}</h2>
                <img
                  className="iconImg"
                  src={`https://openweathermap.org/img/wn/${weatherData.list[0].weather[0].icon}@2x.png`}
                />
              </div>
              <div className="my-4">
                <wjGauge.RadialGauge
                  autoScale={false}
                  thickness={0.2}
                  showText={ShowText.Value}
                  min={-60}
                  max={120}
                  value={weatherData.list[0].main.temp}
                  startAngle={-45}
                  sweepAngle={270}
                  showTicks={true}
                  showTickText={true}
                  tickSpacing={20}
                  isReadOnly={true}
                  showRanges={true}
                  needleLength={"Inner"}
                  needleElement={rg.createNeedleElement([
                    { x: 40, y: 15 },
                    { x: 90, y: 0 },
                  ])}
                >
                  <wjGauge.Range wjProperty="pointer" thickness={0} />
                  <wjGauge.Range min={-60} max={-40} color="MidnightBlue" />
                  <wjGauge.Range min={-40} max={-20} color="DarkBlue" />
                  <wjGauge.Range min={-20} max={20} color="LightBlue" />
                  <wjGauge.Range min={20} max={40} color="Gold" />
                  <wjGauge.Range min={40} max={80} color="GoldenRod" />
                  <wjGauge.Range min={80} max={100} color="FireBrick" />
                  <wjGauge.Range min={100} max={120} color="DarkRed" />
                </wjGauge.RadialGauge>
              </div>

              <div className="container future-weather-background">
                <div className="row align-items-center weekly-temperature">
                  <div className="col">
                    <div className="d-flex justify-content-center">
                      <wjGauge.LinearGauge
                        isReadOnly={true}
                        min={weatherData.list[8].main.temp_min - 10}
                        max={weatherData.list[8].main.temp_max + 10}
                        value={weatherData.list[8].main.temp}
                        showText={true}
                        direction={"Up"}
                        showRanges={true}
                        showTicks={true}
                        showTickText={true}
                        tickSpacing={2}
                      >
                        <wjGauge.Range
                          wjProperty="pointer"
                          color="blue"
                          thickness={0}
                        />
                        <wjGauge.Range
                          min={weatherData.list[8].main.temp_min}
                          max={weatherData.list[15].main.temp_max}
                          color="CadetBlue"
                          thickness={2}
                        />
                      </wjGauge.LinearGauge>
                    </div>
                    <p>{weatherData.list[8].dt_txt.split(" ")[0]}</p>
                  </div>
                  <div className="col">
                    <div className="d-flex justify-content-center">
                      <wjGauge.LinearGauge
                        isReadOnly={true}
                        min={weatherData.list[8].main.temp_min - 10}
                        max={weatherData.list[8].main.temp_max + 10}
                        value={weatherData.list[16].main.temp}
                        showText={true}
                        direction={"Up"}
                        showRanges={true}
                        showTicks={true}
                        showTickText={true}
                        tickSpacing={2}
                      >
                        <wjGauge.Range
                          wjProperty="pointer"
                          color="blue"
                          thickness={0}
                        />
                        <wjGauge.Range
                          min={weatherData.list[16].main.temp_min}
                          max={weatherData.list[23].main.temp_max}
                          color="CadetBlue"
                          thickness={2}
                        />
                      </wjGauge.LinearGauge>
                    </div>
                    <p>{weatherData.list[16].dt_txt.split(" ")[0]}</p>
                  </div>
                  <div className="col">
                    <div className="d-flex justify-content-center">
                      <wjGauge.LinearGauge
                        isReadOnly={true}
                        min={weatherData.list[8].main.temp_min - 10}
                        max={weatherData.list[8].main.temp_max + 10}
                        value={weatherData.list[24].main.temp}
                        showText={true}
                        direction={"Up"}
                        showRanges={true}
                        showTicks={true}
                        showTickText={true}
                        tickSpacing={2}
                      >
                        <wjGauge.Range
                          wjProperty="pointer"
                          color="blue"
                          thickness={0}
                        />
                        <wjGauge.Range
                          min={weatherData.list[24].main.temp_min}
                          max={weatherData.list[31].main.temp_max}
                          color="CadetBlue"
                          thickness={2}
                        />
                      </wjGauge.LinearGauge>
                    </div>
                    <p>{weatherData.list[24].dt_txt.split(" ")[0]}</p>
                  </div>
                  <div className="col">
                    <div className="d-flex justify-content-center">
                      <wjGauge.LinearGauge
                        isReadOnly={true}
                        min={weatherData.list[8].main.temp_min - 10}
                        max={weatherData.list[8].main.temp_max + 10}
                        value={weatherData.list[32].main.temp}
                        showText={true}
                        direction={"Up"}
                        showRanges={true}
                        showTicks={true}
                        showTickText={true}
                        tickSpacing={2}
                      >
                        <wjGauge.Range
                          wjProperty="pointer"
                          color="blue"
                          thickness={0}
                        />
                        <wjGauge.Range
                          min={weatherData.list[32].main.temp_min}
                          max={weatherData.list[39].main.temp_max}
                          color="CadetBlue"
                          thickness={2}
                        />
                      </wjGauge.LinearGauge>
                    </div>
                    <p>{weatherData.list[32].dt_txt.split(" ")[0]}</p>
                  </div>
                </div>
              </div>
            </div>
          </div>
        </>
      )}
    </div>
The properties of the linear gauge are similar to the radial gauge, but you may have noticed direction. This property determines which way the gauge will orient itself. With the property being set to "Up", the gauge is orientated vertically, with the min value being shown at the bottom and the max value shown at the top.
The OpenWeatherMap API is powerful, and there is a lot of data you can use to customize and add further functionality to your app. Pair this with the capabilities of Wijmo's gauges, and you will have a highly capable weather app in a short amount of time!
That's it!
And it is as simple as that! You've successfully created a component-based React app that fetches and displays weather information using the OpenWeatherMap API and Wijmo gauges. Feel free to explore other Wijmo components that will enhance your application even further!
Hope you found this guide helpful. Happy coding!
Ready to Try It Out? Download Wijmo Today!
Tags:
Related Blogs
Try Our JavaScript UI Components & Datagrid

Andrew Peterson