How to Add Runtime Data Binding to Your Angular Reporting App
When building reports, there may be times when you don’t want your report authors to assign the data in the report creation phase; instead, you want to be able to bind the data to your report at runtime, either through user selection or other criteria. Thankfully, ActiveReportsJS makes it easy to bind data sets and assign data fields at runtime.
In this article, we’ll show you how to set up your report to allow data to be bound at runtime. We’ll be covering the following topics:
- Defining the Data Source and Data Set
- Add Controls and Define Data Fields
- Add ActiveReportsJS to Angular Application
- Dynamically Bind Data at Runtime
If you’d like to follow along with the completed report and application, you can find the repository here.
Ready to Start Building Reports? Download ActiveReportsJS Today!
Defining the Data Source and Data Set
First, we’ll need to set up our data source and data sets that we want to use in our report. However, if you’ve used ActiveReportsJS before, we won’t be setting them up in the traditional way.
Normally, when creating a data source, we provide a URL for ActiveReportsJS to use to reach out to the API, and when we create a data set, we provide a Uri and Json path; when setting up a report to be bound at runtime, we don’t provide any of these.
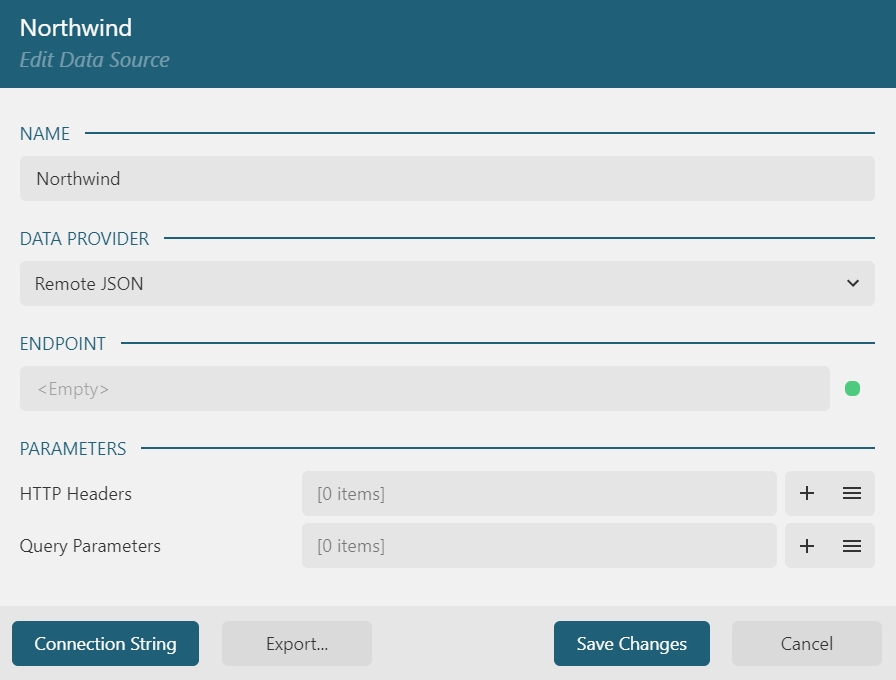
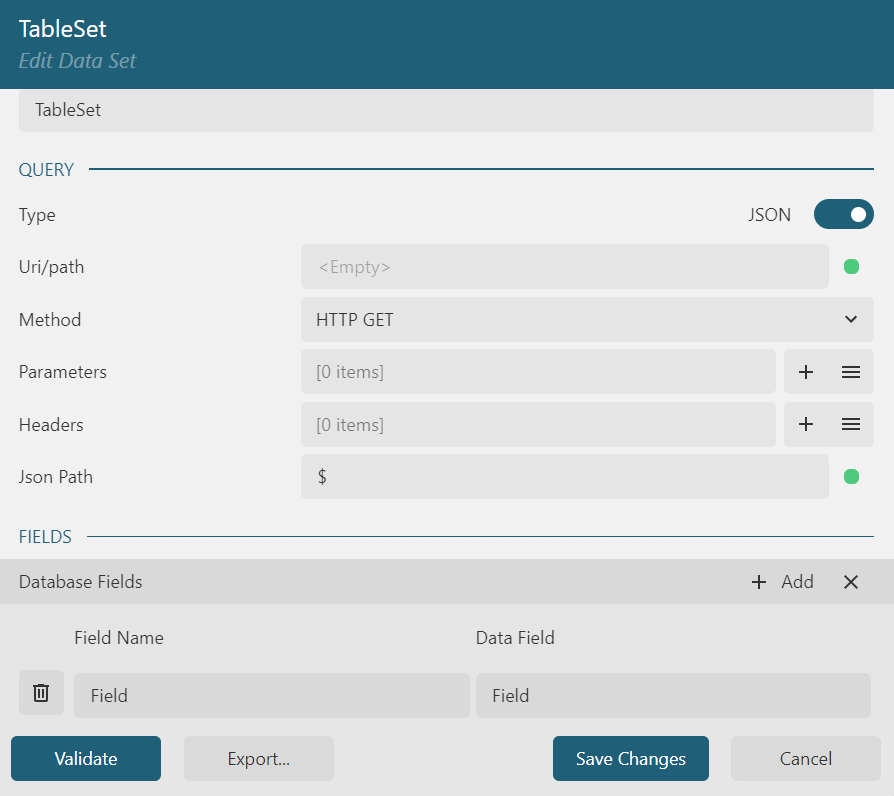
As you can see, we’ve left everything blank; this is because we’re going to set these using TypeScript at runtime.
The reason we set up the data source and data set like so is simple; adding these in the Report Designer adds these properties to the JSON stored in the rdlx-json file. This will allow us to access and set these properties at runtime.
Add Controls and Define Data Fields
Now that we’ve got our JSON properties set up in the rdlx-json through the Data Source and Data Set, it’s time to add some controls to the report body. For our report, we will add a Table; drag and drop a table control from the control toolbox onto the report body.
Now, select the table, and in the Properties Panel of the Report Designer, set the Data Set Name property to our TableSet data set:
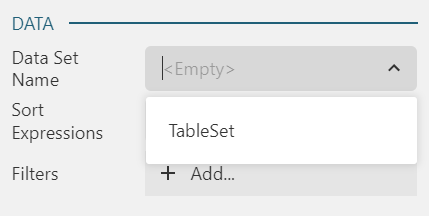
Now, we’ve tied the table control to our data set (which currently has no data). When we bind this data set during runtime, our table will also get bound to the data we provide. However, we’re not done yet.
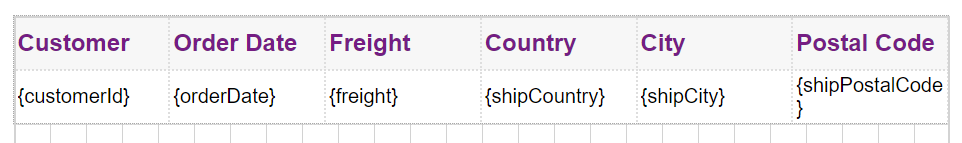
Now, we need to set up our table with properties that will be contained in our data set. The data set that we’ll be using will contain information based on customer orders, so we’re going to reference some of the properties that we know will be in our data set:
Usually, we’d preview the report to see how it would look in the Angular Report Viewer. However, if we try to preview our report, we’ll see an error message:
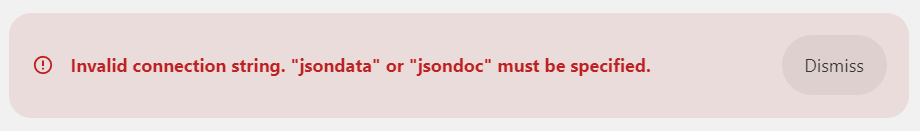
This is because we never properly defined the data source or set, meaning our data set has none of the properties we’re referencing. That’s okay, though, because those will be set at runtime!
Add ActiveReportsJS to an Angular Application
Now that we have our rdlx-json file, we can go ahead and get our application set up to use the ActiveReportsJS Angular Report Viewer.
First, we need to install the ActiveReportsJS Angular library. We have several ways you can install ActiveReportsJS (which you can see here), but for this article, we will be using NPM. To install the ActiveReportsJS NPM packages, run the following command inside your Angular application:
npm i @grapecity/activereports-angularOnce the packages finish installing, we need to import the required ActiveReportsJS CSS files and modules.
For the CSS, add the following code to the top of your application’s styles.css file:
@import "@grapecity/activereports/styles/ar-js-ui.css";
@import "@grapecity/activereports/styles/ar-js-viewer.css";
We have two files we’re importing: ar-js-ui.css and ar-js-viewer.css. The first is the core CSS class, while the second has CSS specifications for the Angular Report Viewer component.
For the module, add the following code to your application’s app.module.ts file:
import { ActiveReportsModule } from '@grapecity/activereports-angular';
...
imports:[
  BrowserModule,
  ActiveReportsModule
]
Now that the CSS and module files have been imported, we can now reference the Angular Report Viewer inside of markup. Inside of the app.component.html file, add the following code:
<div id="viewer-host">
  <gc-activereports-viewer (init)="onViewerInit()"></gc-activereports-viewer>
</div>
Here, we’re creating a div (which we’re also giving an id; more on that in a moment) and referencing the Report Viewer in markup. We’re also tying a method called onViewerInit(), to the Report Viewer’s init event; this event will get called when the Report Viewer is initialized.
Now, inside of the app.component.css file, add the following code:
#viewer-host {
    width: 100%;
    height: 100vh;
}
We’re taking advantage of that div set up in the previous step to set the size of the Angular Report Viewer to take up the entire screen.
The final thing we’ll do in this section is set up the imports in the app.component.ts file, as well as include providers to allow users the ability to export the report:
import { ViewerComponent, AR_EXPORTS, PdfExportService, HtmlExportService, TabularDataExportService } from "@grapecity/activereports-angular";
@Component({
  selector: 'app-root',
  templateUrl: './app.component.html',
  styleUrls: ['./app.component.css'],
  providers: [
    {
      provide: AR_EXPORTS,
      useClass: PdfExportService,
      multi: true,
    },
    {
      provide: AR_EXPORTS,
      useClass: HtmlExportsService,
      multi: true,
    },
    {
      provide: AR_EXPORTS,
      useClass: TabularDataExportService,
      multi: true,
    }
  ]
})
Now that that’s all set up, we can move on to the final section and bind our report to data at application runtime.
Dynamically Bind Data at Runtime
Now that the Angular Report Viewer component is set up, we can write the code that will bind the data to the report when our application runs. The first thing that we’re going to do is create a reference for the report viewer component and define the fields of our data set:
@ViewChild(ViewerComponent, { static: false }) reportViewer: ViewerComponent;
dataSetFields = [
  {
    "Name": "orderId",
    "DataField": "orderId"
  },
  {
    "Name": "customerId",
    "DataField": "customerId"
  },
  {
    "Name": "employeeId",
    "DataField": "employeeId"
  },
  {
    "Name": "orderDate",
    "DataField": "orderDate"
  },
  {
    "Name": "requiredDate",
    "DataField": "requiredDate"
  },
  {
    "Name": "shippedDate",
    "DataField": "shippedDate"
  },
  {
    "Name": "shipVia",
    "DataField": "shipVia"
  },
  {
    "Name": "freight",
    "DataField": "freight"
  },
  {
    "Name": "shipName",
    "DataField": "shipName"
  },
  {
    "Name": "shipAddress",
    "DataField": "shipAddress"
  },
  {
    "Name": "shipCity",
    "DataField": "shipCity"
  },
  {
    "Name": "shipRegion",
    "DataField": "shipRegion"
  },
  {
    "Name": "shipPostalCode",
    "DataField": "shipPostalCode"
  },
  {
    "Name": "shipCountry",
    "DataField": "shipCountry"
  },
];
The reportViewer variable will allow us to call events, methods, and properties of our report viewer component in the TypeScript. We’ve also defined all the fields that will show up in our data so that these fields can be bound to our controls in the report.
Next, we’re going to write the function to load our data. Beneath where we define the data fields, add the following loadData() method:
async loadData() {
  const headers = new Headers();
  const dataRequest = new Request(
    "https://demodata.grapecity.com/northwind/api/v1/Orders",
    {
      headers: headers,
    }
  );
  const response = await fetch(dataRequest);
  const data = await response.json();
  return data;
}
As you can see, it’s very straightforward. We set up our headers and data requests and use these to fetch our data, which we then return.
Now that we can retrieve our data, it’s time to set up a method to load the report. Beneath the previous method, create a method named loadReport():
async loadReport() {
  const reportResponse = await fetch("/assets/DynamicDataBinding.rdlx-json");
  const report = await reportResponse.json();
  return report;
}
Finally, we need to bind our data to the report and load the report into the Angular report viewer. If you remember earlier, when we created the viewer component in markup, we tied a method to the control’s initialized event; it’s time that we implement that method:
async onViewerInit() {
  const data = await this.loadData();
  const report = await this.loadReport();
  report.DataSources[0].ConnectionProperties.ConnectString = 'jsondata=' + JSON.stringify(data);
  report.DataSets[0].fields = this.dataSetFields;
  report.DataSets[0].Query.CommandText = 'jpath=$.*';
  this.reportViewer.open(report);
}
We’re doing a few things here. First, we’re using the data that we get returned to set the Connection String that will be used by the report’s data source.
Then, we use the data fields array that we created earlier to tell the DataSet the different fields it will have in the data set and tell the data set that we want to get all of the data available from our endpoint.
Finally, we call the report viewer’s open() method, passing the report as an argument.
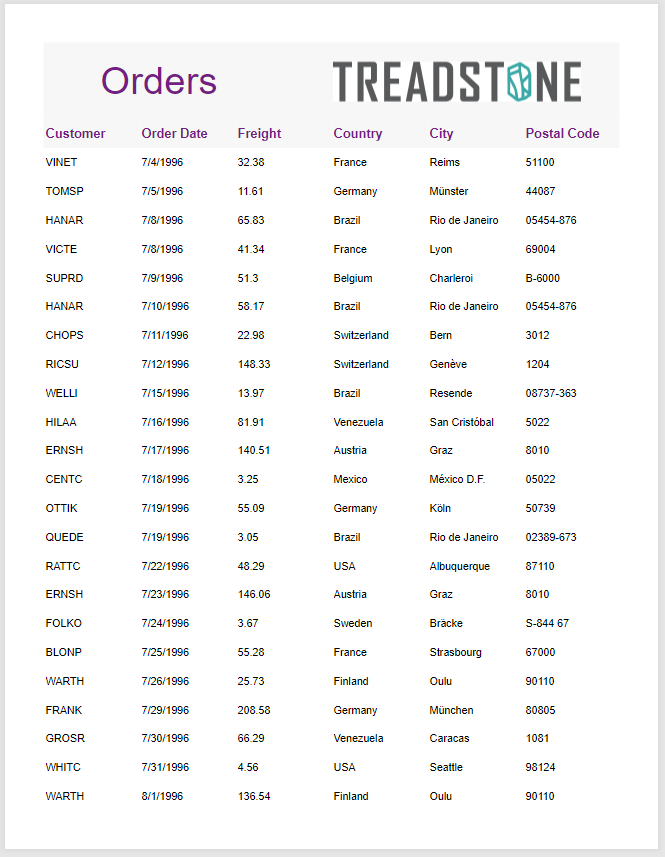
When we run our application, we should see the following in the report viewer:
Conclusion
And with that, we’ve completed our application! In this article, we’ve gone over how you can use the ActiveReportsJS Report Designer to build a report set up for dynamic data binding and how to bind the data to the Angular Report Viewer component at runtime.
If you would like to see the completed application and report, you can find it here. Happy coding!
Ready to Start Building Reports? Download ActiveReportsJS Today!
Tags:
Related Blogs
Try Our JavaScript Reporting Tool
ActiveReportsJS Resources

Joel Parks