How to Create Interactive Drill-Down Reports with Tablix
If you're creating .NET reports with significant amounts of data, it's helpful to have report design alternatives. With different layout options, you can design the report based on the end-users needs. Some users may only need high-level, relevant data, with an option to delve deeper into data at a later time. You can organize the report data in a variety of ways, placing all the data in the report upfront, or you can hide it (until the user clicks to show the details on a drill-down action). You can also add the detail data in drill-through reports.
Using ActiveReports, you can implement drill-down/drill-through in different controls or data regions. However, Table, BandedList, and Tablix are more suitable to use with these features, because they represent hierarchical data.
Let's create interactive drill-down and drill-through reports through a series of blogs using Tablix data region in ActiveReports. Read more about creating drill-down reports using a Table.
In this blog, we'll cover:
- Understanding the need for drill-down in Tablix data region
- Fundamentals of drill-down in Tablix
- Creation of drill-down report using Tablix
Use cases to drill-down in a Tablix data region
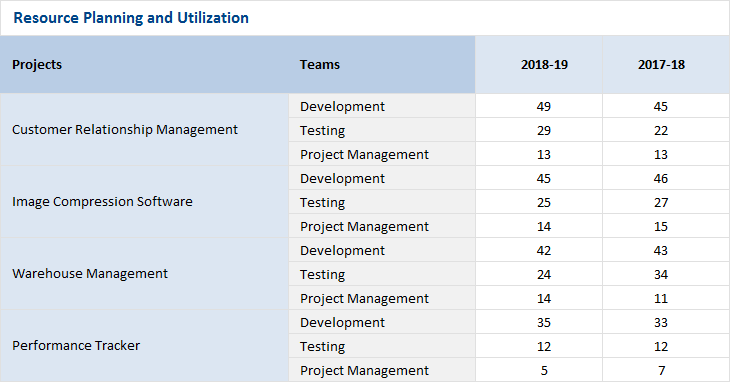
A Project Manager needs to present resource utilization/requirements data to management for next year's budget planning. This report should outline all of the projects along with their team's projects (upcoming as well as current).
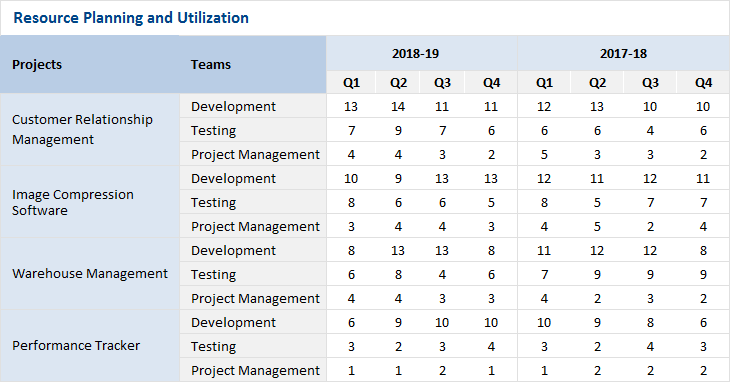
This gives the audience a high-level view. Let's say they are also interested in knowing about the number of resources required for a project in different quarters (to determine budget allotment within the first or second half of the year). Anticipating such varied needs, a Project Manager may need to keep another report on-hand, like this:
It would be ideal to only have one report that serves all end-users needs. A cross-tabulation layout report using Tablix in ActiveReports is the best suited, considering the nature of data. Also, considering the scope of the report, one can initially display the consolidated data and present the detailed information on the fly.
This can be met by creating Drill-down reports like this:

Using these features, you can create varied types of reports -- from a simple 'Resource Allocation Report' (above) to a more complex 'Olympics Medal Report' that displays the results of last five Winter Olympics (as shown below).

Let's first understand the fundamentals of drill-down in Tablix before looking at how drill-down can be applied in Tablix.
Fundamentals of drill-down in Tablix
In another article, we give an overview on the fundamentals of Tablix. Drill-down can be applied on individual components present in the four different areas of Tablix data regions: Corner, Row Group, Column Group, and the Body. The image below gives a high-level idea of the components present in these areas.

Points to know for implementing a drill-down feature in the Tablix:
- Drill-down can be added only from a TextBox control placed in the Tablix data region.
- Drill-down can be added to different components of Tablix, from the accessible cells only.
Let's understand this more from a basic Tablix structure as shown below:

In this case, drill-down can be added from Row group RG1 to child groups (RG2, RG3), intersecting static cells in the group and Body area (S1, S2, B1, B2, etc.). But it can not be added to adjacent row group RG4, the two column groups, other static cells (Total, B5, B6, etc.) and the cells in Corner area.
Similarly, it can be added from the Column group CG1 to the intersecting static cells (B1, B3, B5 and S3). However, it can not be added to other cells in this structure.
The table below enlists the source components from where drill-down can be applied and the target components that will be drilled down in Tablix.
| Source | Target | |||
|---|---|---|---|---|
| Area | Components | Component location | Area | Components |
| Corner | Static cells | Any | All | All groups and cells |
| Row or Column Group | Dynamic cells | Any | Same group area | Child groups |
| Dynamic cells in same/child groups | ||||
| Body | Static cells at the intersection of same group | |||
| Static cells | Inside group | Same group area | Child groups | |
| Dynamic cells in same/child groups | ||||
| Body | Static cells at the intersection of same group | |||
| Outside group | All | All groups and cells | ||
| Body | Static cells | Intersection of both row and column groups | None | None |
| Inside (or intersection of) either row or column group | Group area, Body | All intersecting cells | ||
| Outside row and column group | All areas | All cells | ||
Creation of a Drill-down report using Tablix
Based on the above concept, we'll look at how to create a Drill-down report using Tablix in detail through the Olympics Medal Report. In this report, there are many aspects to covered: countries, medals, sports, and events, that requires the report data to be arranged in a cross-tab layout. Tablix is best suited for this type of report.
This report contains large amounts of data representing the total number of medals won by different countries in different sports/disciplines/events, and for games held in different years. Since the data is spread in multiple pages, analyzing information like total medals won by each country, ranks of different countries, etc. can become difficult. For this reason, adding drill-down for medals and events becomes necessary. This view can be initially hidden and shown when required.
Let's discuss the essential steps for creation of this report.
Step 1: Bind data to the report
In our sample report, we will be fetching data from 'WinterOlympics_Data.json' data attached at th end of this blog.
Step 2: Design report layout using Tablix
2.1. Add Tablix to the report
Add a Tablix data region in report, defining the required row and column groups.
2.2. Bind and display data in Tablix
Specify the expressions for the groups present in the Tablix. This will categorize report data into rows and columns of the data region.
2.3. Configure Tablix to display aggregated data
Next, we should configure the body area of the Tablix to display the aggregated data.
Below is the basic Tablix structure designed for Winter Olympics report following the steps 2.1 to 2.3. We have created two row groups on CountryName and Medal fields, and three column groups on Sport, Discipline and Event fields, adding in the order of hierarchy. Also expression on summation of MedalCount field has been specified in the Body area.
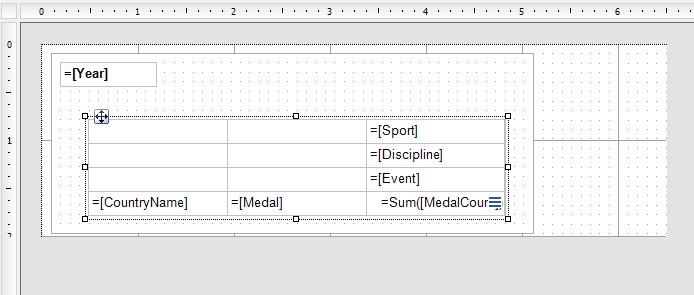
Note: We've additionally embedded the Tablix into a List data region with Detail Grouping set on 'Year' field, just to display year-wise records on each page of the report.
After making some more few visual improvements the report may look like this:

Step 3: Identifying elements/fields for drill-down
Before adding drill-down in the report, it is important to first identify the detailed content present in controls/data regions that could be hidden/shown on the fly, keeping in consideration the scope of report.
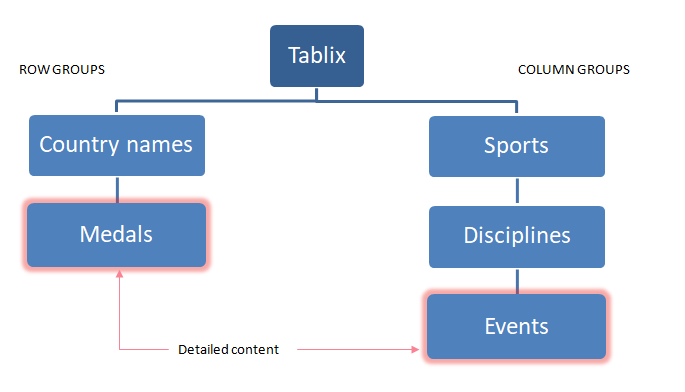
The figure below depicts the logical representation of Winter Olympics data in Tablix, highlighting the groups with the detailed content that could be shown on a drill-down operation.
Step 4: Add drill-down in Tablix.
To implement drill-down to a Tablix cell/group, you need to set:
- Visibility.Hidden property of the target Tablix cell/group to true or false, so that the content is initially hidden or shown,
- Visibility.ToggleItem property of the target Tablix cell/group to the name of TextBox control present in the source Tablix cell, and/or
- InitialToggleState property of the TextBox control in source Tablix cell to 'Collapsed' or 'Expanded'. It defaults to Collapsed, if not specified.
| Target Object | Visibility.Hidden | Visibility.ToggleItem | InitialToggleState (of Source TextBox) |
|---|---|---|---|
| Tablix1_Medal1 | True | txtCountryName | Collapsed |
| Tablix1_Event1 | True | txtDiscipline | Collapsed |
| Tablix1_Discipline1 | False | txtSports | Expanded |
| Tablix1_Sport1 | False | txtHeadingSports | Expanded |
Once adding of drill-down in Tablix data region is completed, the report would look like this:

In our next blog, we'll discuss how drill-through functionality can be added to view different visualizations of the same data using Tablix. If you have a question about Tablix please leave it in the comments below!
Data files
WinterOlympics_Data.json | WinterOlympics_Schema.json
Reports
Download the sample report file

Neha Madan