SpreadJS offers a few different, optional add-ons that greatly enhance the functionality with new features that could be valuable for your applications. The two add-ons we will discuss in this blog are the ReportSheet and GanttSheet.
You can follow along by downloading the sample and watching the video below:
Ready to Get Started? Download SpreadJS Today!
ReportSheet
The SpreadJS ReportSheet add-on allows users to easily design reports, including support for data entry, pagination, data filtering, sorting, and conditional formatting.
Benefits
The main benefits of using a ReportSheet include:
- Integrated Template and Data Management: Allows seamless integration of report settings and data with the combination of ReportSheet and TemplateSheet. The TemplateSheet holds various report-related settings, which ReportSheet utilizes, alongside data from DataManager, to generate corresponding reports efficiently.
- Enhanced Flexibility: Provides highly flexible syntax and API to bind source data. It follows easy data population rules in fields and also provides data entry APIs.
- Ease of Customization: Ensures a standardized format and appearance for all generated reports, maintaining consistency across various data sets.
- Comprehensive Data Handling Features: Manage and present data in a user-friendly manner. ReportSheet is not just about report generation; it's a comprehensive tool that supports data entry, pagination, data filtering, sorting, and conditional formatting.
Features
SpreadJS ReportSheets provide a lot of different features, including:
- Concepts - template cell types, spill direction, context, and render mode
- Layout Settings - spill mode, auto expand, pin, collapse
- Data - data binding, advanced grouping, data filtering, data sorting, calculated columns, and parameters
- Rendering Features - styles, conditional formatting, data validation, cell states, and pictures
- Calculations - calculation engine, hierarchical cells, and template cell alias
- Layout - row and column
- Data Entry - configured via DataManager
- Printing - set paging information via Template Sheet
- Export and Import - JSON, SJS, XLSX, or PDF
These features can help your users create reports directly inside SpreadJS. To see more about these features, check out the SpreadJS JavaScript Demos.
Sample
Adding a ReportSheet to SpreadJS is as simple as:
- Referencing the ReportSheet library
<head>
   ...
   <script src='.../spreadjs/gc.spread.sheets.all.x.x.x.min.js' type='text/javascript'></script>
   <script src='.../spreadjs/plugins/gc.spread.sheets.print.x.x.x.min.js' type='text/javascript'></script>
   <script src='.../spreadjs/plugins/gc.spread.reportsheet.x.x.x.min.js' type='text/javascript'></script>
</head>- Creating a table in the DataManager
const spread = new GC.Spread.Sheets.Workbook('ss', { sheetCount: 1 });
const ordersTable = spread.dataManager().addTable('Orders', {
    remote: {
        read: {
            url: 'https://demodata.mescius.io/northwind/api/v1/orders'
        }
    }
});- Creating a TemplateSheet
const reportSheet = spread.addSheetTab(0, 'report1', GC.Spread.Sheets.SheetType.reportSheet);
const templateSheet = reportSheet.getTemplate();- Setting the value and binding for the TemplateSheet
const columns = ['orderId', 'customerId', 'orderDate', 'freight', 'shipName', 'shipCity', 'shipCountry'];
columns.forEach((columnName, i) => {
    templateSheet.setValue(0, i, `${columnName[0].toUpperCase()}${columnName.substring(1)}`);
    templateSheet.setTemplateCell(1, i, {
        type: 'List',
        binding: `Orders[${columnName}]`,
    });
});- Refreshing the report
reportSheet.refresh();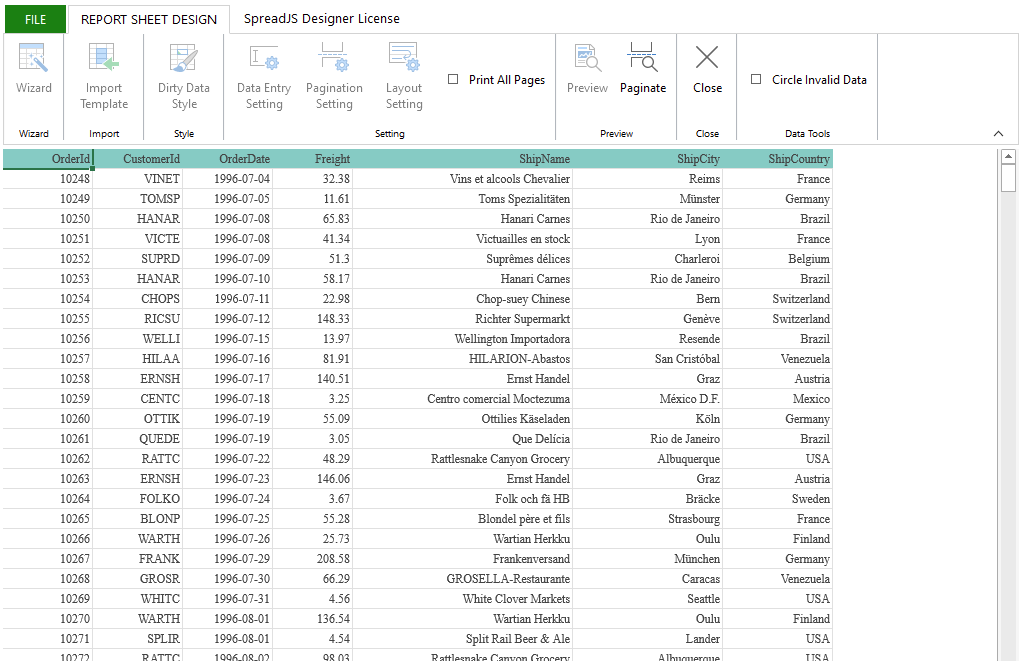
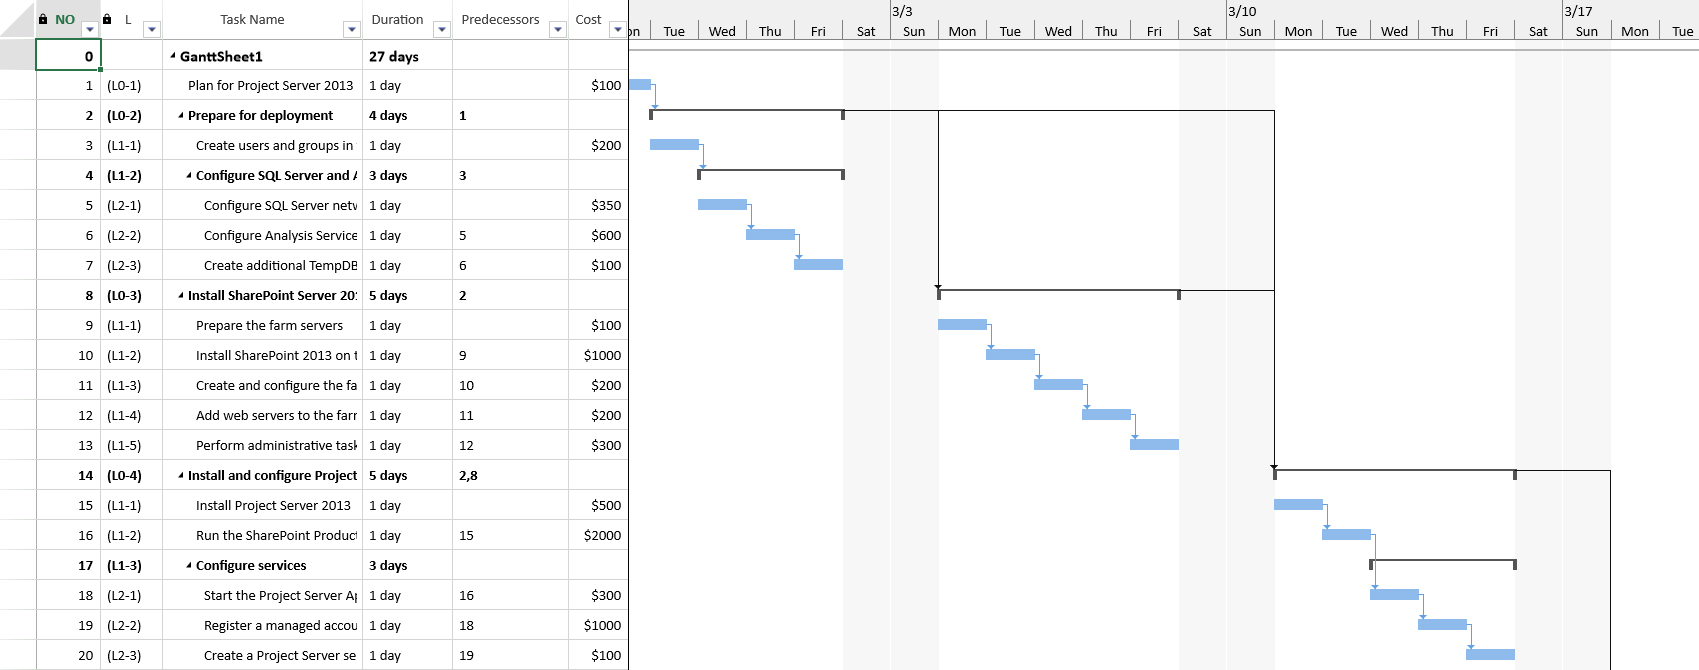
GanttSheet
The SpreadJS GanttSheet add-on provides Gantt Chart behavior using a fast, data-bound DataTable and a spreadsheet user interface. This add-on includes standard Gantt functionality: Timescales, Taskbars, Tasks, Calendar capabilities, and more.
Benefits
The main benefits of using a GanttSheet include:
- Visual Planning: Provides a clear visual representation of project tasks, timelines, and dependencies, making it easier to plan and manage projects effectively.
- Task Dependencies: Allows you to define and visualize task dependencies, helping you understand how different tasks are linked and the impact of delays on the overall project timeline.
- Progress Tracking: Tracks the progress of each task and the overall project by marking completed tasks and comparing them with the planned timeline.
- Deadline Management: Enables you to set and manage project milestones and deadlines, ensuring that the project stays on track and is completed within the specified time frame.
Features
The SpreadJS GanttSheet Add-on provides features to help with implementing Gantt Chart functionality, including:
- Timescales - zooming and scrolling
- Styles - taskbar style rules, taskbar styles, gridlines, and nonworking time
- Layout - line mode, taskbar height, date text formatting, and taskbar rounding
- Tasks - task operations, task completion
- Calendar - working time and different calendars
- Resources - connect resources to tasks
- Sorting - sort tasks by specific task fields
- Export and Import - JSON, SJS, XLSX, and PDF
To see a deep dive into these features, check out the demos here: Overview | Features | SpreadJS JavaScript Demos
Sample
Adding a GanttSheet to SpreadJS is as simple as:
- Referencing the GanttSheet library
<script src="/spreadjs/demos/en/purejs/node_modules/@mescius/spread-sheets-ganttsheet/dist/gc.spread.sheets.ganttsheet.min.js" type="text/javascript"></script>- Adding a table to the DataManager
var tableName = "Gantt_Id";
var baseApiUrl = getBaseApiUrl();
var apiUrl = baseApiUrl + "/" + tableName;
var dataManager = spread.dataManager();
var myTable1 = dataManager.addTable("myTable1", {
    batch: true,
    remote: {
        read: {
            url: apiUrl
        }
    },
    schema: {
        hierarchy: {
            type: "Parent",
            column: "parentId"
        },
        columns: {
            id: { isPrimaryKey: true },
            taskNumber: { dataType: "rowOrder" }
        }
    }
});- Creating the GanttSheet
var ganttSheet = spread.addSheetTab(0, "GanttSheet1", GC.Spread.Sheets.SheetType.ganttSheet);- Adding a view
var view = myTable1.addView("myView1", [
    { value: "taskNumber", caption: "NO", width: 60 },
    { value: '=CONCAT("(L",LEVEL(),"-",LEVELROWNUMBER(),")")', caption: "L" },
    { value: "name", caption: "Task Name", width: 200 },
    { value: "duration", caption: "Duration", width: 90 },
    { value: "predecessors", caption: "Predecessors", width: 60 },
    { value: "cost", caption: "Cost", style: { formatter: "$0" } }
]);- Binding that view to the new GanttSheet
view.fetch().then(function() {
    ganttSheet.bindGanttView(view);
});
These add-ons, including the PivotTable and Designer Ribbon, can be purchased separately or with your existing SpreadJS licenses. For pricing information, check out our website: JavaScript Spreadsheet Pricing. For more information about these add-ons, check out our Documentation and Demos, and download a trial of SpreadJS today!
Tags:
Related Blogs
Try Our JavaScript Spreadsheet Components
SpreadJS Resources

Kevin Ashley