Tables are common in web products because they’re one of the easiest ways to organize complex data. If your data can be represented with rows and columns, using an HTML table is the best way to display it.
However, as you’ll quickly find out, HTML tables are primitive as they don’t allow you – without adding JavaScript code – to run operations such as sorting, filtering, paginating, or exporting your data.
As a result, many JavaScript libraries provide data tables that can be used to show complex reports, dashboards, financial data, sales results, and even interactive spreadsheets.
Today, dedicated data table controls handle the table part for you. It’s not recommended to code tables in an old-fashioned way.
If you have been involved in developing data-heavy business applications, you already have an idea of how difficult it is to build these apps in a readable and maintainable way. Building a data table component that’s flexible enough to adapt to your data and business requirements can save you a lot of time. But again, developing this component is also a time-consuming task… How about outsourcing it?
Vue.js is a library for building user interfaces. It doesn’t include a built-in data table component, but many open-source libraries provide an easy-to-use API to create a data table in your Vue apps instead of coding it yourself. Naturally, you’ll need to customize it or add functionality to accommodate your use cases.
This article will show you how to implement and use a smart data table in Vue. You’ll see how to use an open-source library and customize it for our particular requirements, and then compare this process with a commercial solution from GrapeCity, which doesn’t need customization for most of our requirements and offers better support and updates for the latest Vue versions. We will cover:
- What Should a Smart Data Table Be Able to Do?
- Open-Source Data Table Libraries
- Implement an Open-Source Data Table in a Vue App
- Implementing Resizable Columns
- There Must be a Better Way
- A FlexibleVue 3 Data Table
- Export to Excel with FlexGrid
To follow along, you need to be familiar with JavaScript and Vue.js. You also need to have Node.js installed on your development machine because the Vue CLI relies on it.
Download the source code for this project from this GitHub repository.
Ready to Try it Out? Download Wijmo Today!
What Should a Smart Data Table Be Able to Do?
Some features users expect to find in a modern data table are:
- Load data from a variety of sources, including local files , databases, and APIs
- Searching, filtering, and sorting options
- Load and display large datasets with pagination
- Showing and hiding columns
- Inline editing and writing or exporting the edited data
- Support for multiple devices (responsiveness)
- Resizable columns to accommodate long data points inside a column
- Horizontal and vertical scroll support
- Data validations and visualizations, such as sparklines
Some frameworks have built-in implementations with a few basic features, but you have to code the advanced ones yourself.
For example, since data tables are used to work with complex datasets, they typically need to support the various mechanisms to import and export data with Excel spreadsheets, databases, and even REST APIs.
Open-Source Data Table Libraries
As mentioned before, Vue provides no built-in data table component, but the community of developers around it have created and open-sourced many libraries specifically designed to bridge this gap.
If you do a quick search, you’ll find many free and open-source table controls for Vue.
Here are some data table libraries that you could use in your Vue apps:
- Vuetify: a v-data-table component used for displaying tabular data. Features include sorting, searching, pagination, content-editing, and row selection.
- Vue-data-tables: a simple, customizable, and pageable table with server-side rendering (SSR) support, based on element-ui.
- Enso Data table: a data table package with server-side processing, unlimited exporting, and Vue components. It enables you to build complex tables based on a JSON template quickly. This package can work independently of the Enso ecosystem.
- Buefy Table: a set of lightweight UI components for Vue based on Bulma, including a data table that provides basic features like sorting, search, and pagination.
Implement an Open-Source Data Table in a Vue App
Let’s implement a data table in an example Vue app as an example of how you can quickly integrate an open-source component. We’ll use Vuetify, a component framework based on Material Design for developing Vue apps, including its own data table component.
Vuetify’s data table component is flexible: it supports basic features such as sorting, filtering, editing, and pagination. However, you’ll still need to add code for customizing the component in many scenarios, especially for advanced features such as exporting and importing data.
It also is missing useful UI features that can help you work comfortably with big datasets, such as resizing columns to see the full content, row step alternation, and so on.
Let’s get started by installing the Vue CLI, the official utility for generating Vue projects.
You need to have Node.js and npm installed on your local development machine. If you don’t have these, install them by following one of the methods below:
- Go to the official website and download the binaries for your system
- Use the official package manager for your system
- Use a Node version manager like NVM, which will enable you to manage multiple versions of Node on your system
Now open a new terminal and run the following command:
$ npm install -g @vue/cli
Next, run the following command to generate a new Vue project:
$ vue create vuedatatabledemo
You’ll be prompted to select a preset. Select Default ([Vue 2] babel, eslint).
Currently, Vue 3 is already released, but most libraries are not updated to support this version, so we'll have to use Vue 2 for this part of the article.
Navigate to your project’s folder and start a development server as follows:
$ cd vuedatatabledemo
$ npm run serve
Open your web browser and navigate to http://localhost:8080/ to see your Vue app running.
Now we need a REST API backend for getting data. Building an actual REST API is beyond the scope of this tutorial, so we’ll use json-server to mock a REST API from JSON data quickly.
Open a new terminal and run the following command:
$ npm install -g json-server
Next, inside your Vue project, create the db.json file and copy the product data from this db.json file, or save it directly to your project’s folder.
Run your server using the following command:
$ json-server --watch db.json --port 8000
You’ll have a http://localhost:8000/products endpoint that exposes the product data from the JSON file.
Let’s see how to consume this REST API from our Vue app and display the products in a data table. Install Vueltify, Axios, and Vue Axios.
Install Vuetify in your project using the following command:
$ vue add vuetify
You’ll be prompted to pick a preset – go with the default one.
Next, install Axios and Vue Axios using the following command:
$ npm install axios vue-axios
Open the src/main.js file and add the following code to import Axios:
import axios from 'axios'
import VueAxios from 'vue-axios'

Vue.use(VueAxios, axios)
Define Data Tableopen the src/App.vue file and update it as follows:
<script>
import axios from "axios";

export default {
  name: 'App',
  components: {
  },
  data: () => ({
      products: [],
      loading: true,
      headers: [
        { text: "Product Name", value: "name" },
        { text: "Type", value: "type" },
        { text: "SKU", value: "sku" },
        { text: "Manufacturer", value: "manufacturer" },
        { text: "Model", value: "model" },
        { text: "UPC", value: "upc" },
        { text: "Price", value: "price" }
      ]
  }),
  methods: {
    fetchData() {
      this.loading = true;
      axios.get("http://localhost:8000/products").then((response) => {
          this.loading = false;
          //console.log(response);
          this.products = response.data;
        });
    },

  },
  mounted() {
    this.fetchData();
  }
};
</script>
In this code snippet, we start by importing Axios.
Next, in the data section, we define the loading, products array, and headers array that hold the loading state, the fetched products, and the headers of the data table, respectively.
We then define the fetchData method that calls the get method of Axios to send a GET request for fetching products.
Finally, in the mounted life-cycle method of our Vue component, we call the fetchData method to actually fetch the products and add them to the products array.
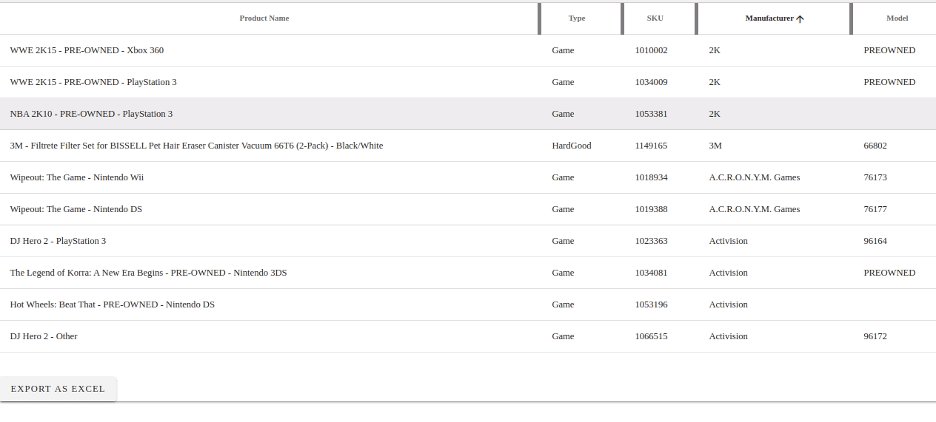
Next, let’s create the data table in the template by adding the following code to the same src/App.vue file:
<template>
  <v-card class="p-64">
    <v-data-table ref="myTable"
      :headers="headers"
      :items="products"
      :items-per-page="10"
      class="elevation-1">
    </v-data-table>
  </v-card>
</template>
We use a v-card to create the Material card and, inside it, we use v-data-table to create the data table.
Implementing Resizable Columns
By default, the open-source data table does not have easily resized columns. Let’s see how we can enable column resizing in our data table. In StackOverflow, a user is asking how to resize columns of the Vuetify datatable, but there is no plan to implement this feature by the team behind Vuetify, so we are out of luck. We’ll have to implement this feature ourselves.
Open the src/App.vue file, add a resizableColumns method to the methods section of the component, and call it from the mounted method as follows:
// [...]
export default {
  name: 'App',

  components: {
  },
  data: () => ({
   // [...]
  }),
    methods: {
    // [...]
    resizableColumns() {}
    // [...]
    },
    mounted() {
    // [...]
    this.resizableColumns();
    }
  }
Next, let’s implement the method. Start by getting a reference to the table element in the page and define the variables as follows:
resizableColumns() {
    let table = document.querySelector('table');
    var initialPageX;
    var currentColumn;
    var nextColumn;
    var currentColumnWidth;
    var nextColumnWidth;
The currentColumn variable refers to the column we are currently resizing, and the nextColumn variable holds its next sibling. The initialPageX variable contains the horizontal coordinate at which the mouse is clicked.
Next, we need to query for all the table headers, iterate through them, then create and append a div element to each div element of the table with the same height at the right side. This div element is used as a bar that will be dragged to resize the column.
   if (table){
        const columnHeaders = document.querySelectorAll('th');

        for (var i = 0; i < columnHeaders.length; i++){
             var bar = createBar(columnHeaders[i].offsetHeight + 'px');
             columnHeaders[i].appendChild(bar);
             columnHeaders[i].style.position = 'relative';
        }
    }
Next, define the createBar method as follows:
function createBar(height) {
  var div = document.createElement('div');
  div.style.top = 0;
  div.style.right = 0;
  div.style.width = '9px';
  div.style.borderRight = '5px solid grey';
  div.style.position = 'absolute';
  div.style.cursor = 'col-resize';
  div.style.userSelect = 'none';
  div.style.height = height;
  div.style.zIndex = 1;

  div.addEventListener('mousedown', function (e) {
    currentColumn = e.target.parentElement;
    nextColumn = currentColumn.nextElementSibling;
    initialPageX = e.pageX;

    currentColumnWidth = currentColumn.offsetWidth;
    if (nextColumn)
      nextColumnWidth = nextColumn.offsetWidth;
  });

  document.addEventListener('mouseup', function () {
    currentColumn = undefined;
    nextColumn = undefined;
    initialPageX = undefined;
    nextColumnWidth = undefined;
    currentColumnWidth = undefined
  });

  document.addEventListener('mousemove', function (event) {
    if (currentColumn) {
      var resizeAmount = event.pageX - initialPageX;
      currentColumn.style.width = (currentColumnWidth + resizeAmount) + 'px';

      if (nextColumn)
        nextColumn.style.width = (nextColumnWidth - resizeAmount) + 'px';

    }
  });
  return div;
}
We create a div with the passed height and set some event listeners.
When the mouse is clicked, we set the current and the next column and their widths. When the mouse button is up, we reset those variables to undefined. When the mouse is moving, we calculate the amount by which we need to resize the column by subtracting the current horizontal position of the mouse from the initial position. We then add the computed amount to the width of the current column and subtract it from the width of its neighbor.
This is not yet perfect, but this shows how we can add resizing to our data table. Here is a demo of the implemented feature:
There Must be a Better Way
That was a lot of work to get a data table into a Vue app and implement a feature common to spreadsheet apps — simply resizing a column — that the open-source development team doesn't seem to want to support.
On top of that, it's not even compatible with the current version of Vue!
You’d need to implement any other feature that’s missing in your data table yourself, and you may need far more code than what we have added to implement just the column resizing. This would add to your plate time-consuming tasks, which might delay the delivery of your project. You can avoid this completely by using ready data table solutions.
GrapeCity provides several data tables you can add to your Vue app with a few lines of code. These data tables already include column resizing and many other features that you may need to cover your use cases.
GrapeCity offers three components for handling data:
- Wijmo FlexGrid
- SpreadJS
- DataViewJS
All three are lightweight, and they are a perfect fit if you need advanced features such as drag-and-drop for rows, several selection modes, sorting, column reordering, grouping, filtering, editing, custom cells, XAML-style star-sizing columns, and so on. They can handle as much data as you want to throw at them as they are optimized for performance while handling large datasets.
The FlexGrid control provides a powerful and flexible way to display and edit data in a tabular format. It’s a full-featured grid that offers all the features you are used to, including several selection modes, sorting, column reordering, grouping, filtering, editing, custom cells, and so on.
SpreadJS is a JavaScript spreadsheet that allows you to provide a true Excel-like experience from your JavaScript application with zero dependencies on Excel.
This enables you to create custom spreadsheets, advanced grids, dashboards, and reports with a powerful, high-speed calculation engine, with the ability to import from and export to Excel files.
More than that, it has full support for the three popular JavaScript frameworks — React, Vue, and Angular — and also for TypeScript.
A FlexibleVue 3 Data Table with Wijmo FlexGrid
Let’s see how we can integrate FlexGrid into our Vue application.
Head back to your terminal and run the following command to install the Wijmo components for Vue:
$ npm install @grapecity/wijmo.vue2.all jszip
Next, open the src/App.vue file and add the following line to import the CSS styles:
<style>
@import '../node_modules/@grapecity/wijmo.styles/wijmo.css';
</style>
Add the following code to create a data table with FlexGrid:
import  { FlexGrid } from '@grapecity/wijmo.grid';

export default {
  name: 'App',

  components: {
  },
  data: () => ({
      products: [],
      loading: true,
      theGrid: null,
      /* [...] */
}),

    methods: {
    fetchData() {
      this.loading = true;
      axios.get("http://localhost:8000/products").then((response) => {
          this.loading = false;
          //console.log(response);
          this.products = response.data;
           this.createWijmoTable();
        });
    },
    createWijmoTable(){
      this.theGrid = new FlexGrid('#theGrid', {
        stickyHeaders: true,
        autoGenerateColumns: true,
        alternatingRowStep: true,
        itemsSource: this.products
        });
    },
    // [...]
In the above code snippet, we first import the FlexGrid grid, then define the Grid variable in the data section of the component.
Next, we add the createWijmoTable method, in which we create our data table. Finally, we call this method in the then callback of the Axios.get method to create the table when the data is fetched.
We use the itemsSource property to import data into the grid, and other properties to enable or disable specific features.
In the same file, update the code inside the template section as follows:
<template>
  <v-card class="p-64">
<!-- [...] -->
      <div id="theGrid"></div>
  </v-card>
</template>
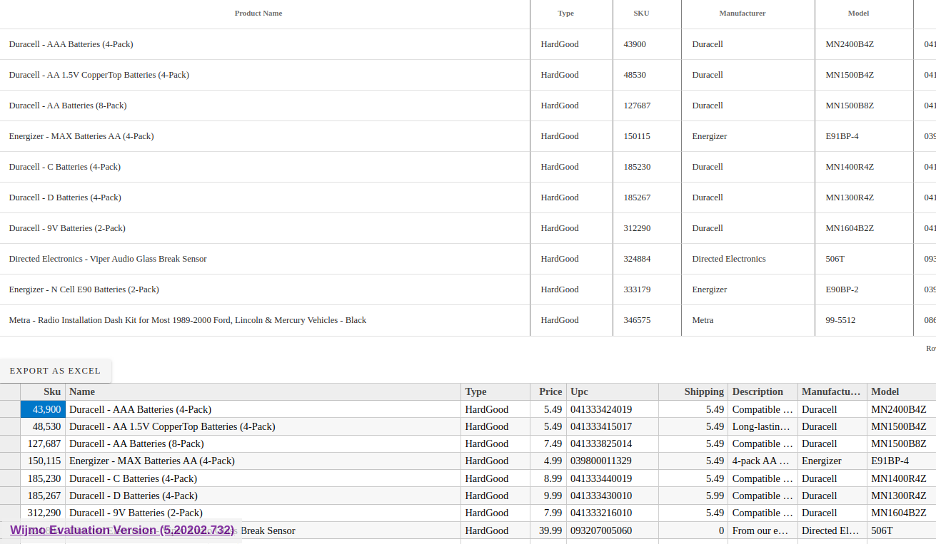
As you can see, without adding any custom code, we can now resize columns by default:

FlexGrid provides other features out-of-the-box, such as sticky headers, auto column generation, row step alternation, and so on.
Export to Excel with FlexGrid
Let’s add the code to enable exporting the data table to Excel. Go back to the src/App.vue file and start by importing the library for adding Excel support as follows:
import * as wjGridXlsx from '@grapecity/wijmo.grid.xlsx';
Next, define the following method:
exportExcelFlexgrid() {
      var book = wjGridXlsx.FlexGridXlsxConverter.save(this.theGrid, {
        includeColumnHeaders: true,
        includeRowHeaders: true,
      });
      book.sheets[0].name = 'FlexGrid Data';
      book.saveAsync('FlexGrid-Export.xlsx');
    },
Finally, add a button to the template:
<v-btn @click="exportExcelFlexgrid">Export as Excel</v-btn>
Now, we can edit our data and then export the data table to an Excel file using the Export as Excel button.
See the sample code working in StackBlitz.
Wrapping Up
There are many ways to create and use smart data tables in Vue, with some approaches requiring a lot more manual work than others. The community has provided many free and open-source table libraries that meet many of the typical basic requirements.
However, in business and enterprise projects, where time is money, a commercial library like Wijmo can easily pay for itself many times over.
For example, Vue 3 is released. Most open-source data table libraries are not yet updated to support this version – but Wijmo already has Vue 3 support!
Ready to Try it Out? Download Wijmo Today!
Tags:
Related Blogs
Try Our JavaScript UI Components & Datagrid

Chris Bannon