SpreadJS can be used to create all sorts of spreadsheets, reports, statements, and much more. This blog will show you how to create a sample Financial JavaScript Profit and Loss (P&L) Statement with the SpreadJS Designer Runtime. This developer tool included with SpreadJS lets you have the same standard spreadsheet UI that you would expect when creating and changing a PivotTable.
To provide this Designer UI to your customers, you would need to purchase the SpreadJS Designer Component add-on.
Download the sample for this tutorial.
Ready to Start Analyzing? Download SpreadJS Today!
Creating the PivotTable
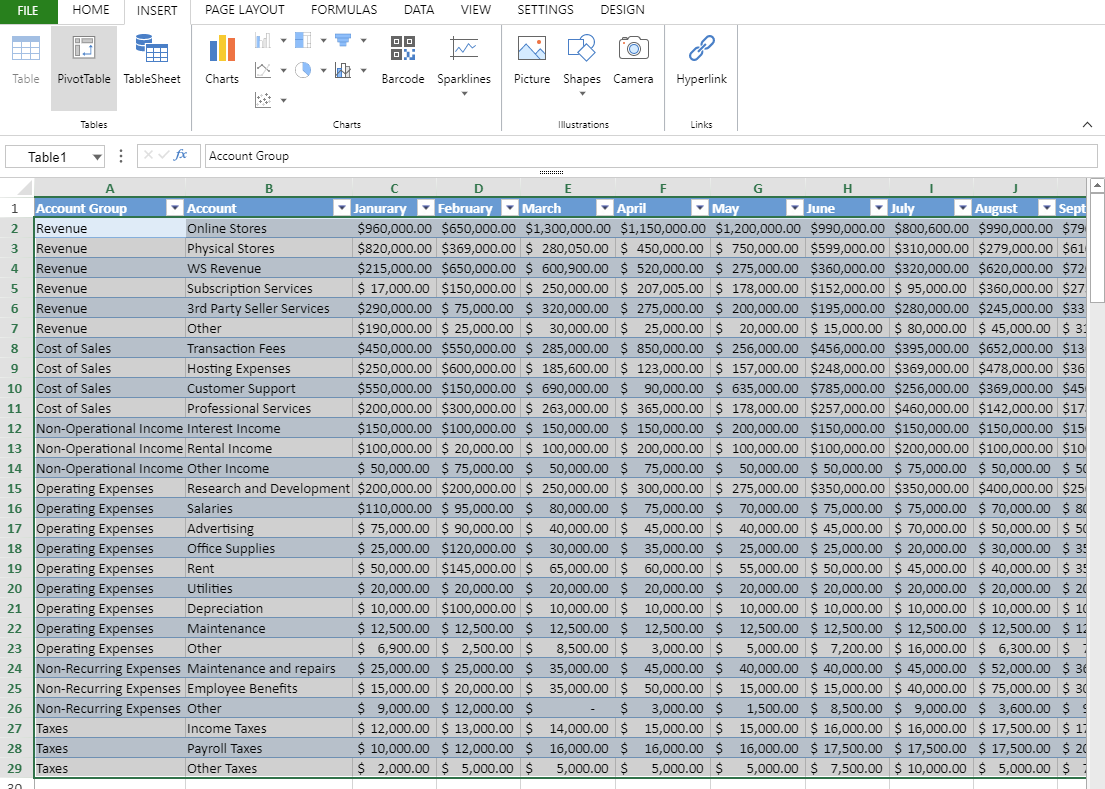
Before we can create a PivotTable, we must first create a table of data. We have already made a table on its own sheet in this case. To start the PivotTable in the Designer, select the entire table first and click the "PivotTable" button in the Insert tab.
This will open the Create PivotTable dialog that lets you specify the data source and the location to put the PivotTable. In this case, we will use the existing table and create the PivotTable on a new worksheet.

This will create the PivotTable with some standard settings on another sheet.
PivotPanel
To make this sample easier, we will only check the Account Group, Account, Fiscal Year Actual, and Fiscal Year Budget fields in the PivotPanel. This panel shows up on the right side of the screen when selecting a PivotTable.

Once you check those fields, the PivotTable will be shown with the selected fields.

Value Field Settings
By default, the values in the PivotTable are not formatted correctly, and some field headers have extra words like "Sum of," for example. We can change the formatting of the values and headers by right-clicking on the value field in the PivotPanel.
This will bring up the Value Field Settings dialog, which you can use to set a custom name for the header and a number format for the values, as shown here.
Calculated Items
The next step is to add some calculated items to the PivotTable. These are essentially data fields that aren't present in the original data but reference those fields. We can see how these work by opening the Calculated Item dialog with the PivotTable Analyze tab.

With that dialog open, we can create a calculated item, in this case, "Gross Profit," which is simply the Revenue minus the Cost of Sales. To fill out this formula, we first need to double-click on the item’s field (Account Group) and then the item (Revenue or Cost of Sales).
This will populate the formula bar with the correctly formatted references. Now click on "Add." That calculated item will be added to the PivotTable.

We can also add a calculated field in the form of Variance, which is just the Fiscal Year Actual minus the Fiscal Year Budget.

Themes and Styling
To make the PivotTable a bit easier to understand, we can also collapse certain sections and apply a theme. Themes/Styles can be found in the Design Tab under the "PivotTable Styles" dropdown.

We can also remove the gridlines from the sheet to make it look nicer by clicking on "GridLines" under the "Settings" tab and deselecting the Horizontal and Vertical Gridline options:

Conditional Formatting
The final edit we can make is applying conditional formatting to specific fields to make the data stand out more. In this case, we can add a formatting rule to the variance field to highlight whether it was above or below budget. We first need to select the cells to which we want to apply conditional formatting, then use the Conditional Formatting drop-down in the Home tab and add an icon set rule.


Following this tutorial, you should have a complete JavaScript Profit and Loss PivotTable that you created entirely within the SpreadJS Designer! There are many more things that you can do with SpreadJS PivotTables, and we have only scratched the surface.
To open this file again or use it in an HTML page with SpreadJS, simply navigate to File>Save to save it as an SJS file:

To try out these and many other features, download a trial of SpreadJS today!
Tags:
Related Blogs
Try Our JavaScript Spreadsheet Components
SpreadJS Resources

Kevin Ashley