
FlexMap: A GeoJSON Map Control for ASP.NET MVC
Bring your data to life and create stunning visualizations with geographic data.
FlexMap, ComponentOne's ASP.NET MVC Map control, supports interactive maps that can visualize your geographic data in a number of ways.
- Display data-bound points or markers on the map
- Visualize geographies with color-coded regions
- Fully interactive with zoom, pan, and tooltip support
- Easy-to-use GeoJSON data binding
Why Choose FlexMap for ASP.NET MVC?
Connect New Layers of Analysis to Your Dashboards
When data is associated with a specific location on a map, users are able to fully analyze their data from a birds-eye view.
Create Point and Bubble Maps
Point and bubble maps display data points at bound coordinates so users can visualize the geographic distance between each item, as well as the size of the dot.
Build Colorful Choropleth Maps
Choropleth maps are a common visualization approach that shows color-coded geographical data with a gradient scale.
ASP.NET MVC Map Key Features
Display GeoJSON Maps
Use the MVC map control to display maps defined in GeoJSON data files. GeoJSON is a JSON-based format that describes various geographical features (i.e., countries, provinces, cities, etc.) and can include other non-spatial data related to these features. Use the MVC map control to render GeoJSON data or take it one step further by adding additional visualization, such as color-coded regions or data points on the map. We've included several JSON map sources, but you can always add your own.
Bind the FlexMap control to a GeoJSON data source by just providing a URL. Map JSON properties to the X and Y axes, such as latitude and longitude.
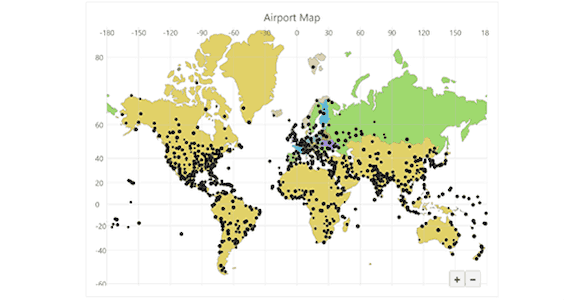
Showcase Scatter Points on the Map
A common way to visualize data on a map is to plot a data point (or marker) at certain coordinates containing additional information. FlexMap supports a ScatterMapLayer that users can bind to an ItemsSource and map to latitude, longitude, and size values. The size value can render the points in various sizes, including a bubble chart.


Create Color-Coded Regions
Choropleth maps are a common visualization approach that shows color-coded geographical data. The GeoMapLayer and ScatterMapLayer support a color scale that defines how to calculate the color used for specific geographical features. FlexMap supports many different built-in color palettes to choose from or customize your own. You can also include a legend for the color scale.
Present Interactive Zoom and Pan Features
The MVC map control supports mouse and touch-enabled zoom and pan features. Users can also click the built-in buttons to zoom in and out.


Display Gridlines on the Map
Gridlines are the lines on a map that help you know the coordinates of any given location. The most commonly shown coordinates are latitude and longitude, but users can add a geographical grid layer to FlexMap that automatically draws lines at every 20 or 30 degrees.


