
80+ Chart Types, High-Performance WPF Chart Controls
Build stunning dashboards for the desktop using FlexChart, a .NET WPF chart control.
- Choose from popular and advanced chart types including radar, sunburst, funnel and heatmap
- Enhance your WPF charts with dozens of user interaction and data analysis features
- Load millions of data points with high-performance Direct2D rendering
Overview
WPF chart controls are UI libraries for creating and displaying 2D charts in desktop applications. ComponentOne FlexChart provides bar, line, area, and many other chart types to help developers visualize data in meaningful ways.
Why Choose FlexChart for WPF?
80+ Chart Types and Variations
Build the exact chart you need with FlexChart's many built-in WPF chart types, combination plots and stacking options.
Specialized Chart Components
Get optimized WPF chart components for pie, radar, polar, sunburst, treemap, and financial charts.
Create Interactive Dashboards
Bring your data visualizations to life with interactive features like scrolling, zooming, selection and drill-down.
Built-In Analysis Features
Write less code with built-in data analysis features such as waterfall series, error bars and trendlines.
Flexible Customization
FlexChart exposes flexible event handlers and properties that allow custom styles for data points and labels.
MVVM Development Friendly
Fully declare FlexChart in XAML, following Model-View-ViewModel (MVVM) best practices, or code completely in C#.
Fast, High Performance Rendering
With Direct2D rendering available in FlexChart for WPF, your charts will look and perform great.
Cross-Platform Compatibility
Shorten your cross-platform migration using the same chart API across desktop, mobile and web.
WPF Chart Types
Bar and Column Charts

Column Charts
Compare multiple data series over time in a vertical bar or column chart. FlexChart supports displaying negative values below the axis origin.

Bar Stacked Charts
Stacked charts demonstrate the part-to-whole relationship for displaying the cumulative values of categories. FlexChart provides options to stack column charts in groups.

Bar Stacked 100 Charts
Compare percentages for each value within the total. The cumulative proportion of each stacked column always totals one hundred percent.

Bar Charts
Rotate the WPF column chart to compare multiple, categorical data series in a basic horizontal bar chart.

Floating Bar Chart
A floating bar or range column chart shows two values, a minimum and maximum, for each column or bar. The plot can be rotated to create a Gantt-style chart as well.

Tornado Charts
Tornado charts, also known as wing bar or butterfly charts, are a variation of WPF bar charts for comparing two sets of data values in a vertical stack of horizontal bars.
Line and Area Charts

Line Charts
Display changes in data over short and long periods of time with a basic line chart with optional symbols.

Line Stacked Charts
Stacked line chart series do not overlap because they are cumulative at each point, and ideal for visualizing the overall total.

Step Charts
Step line charts help visualize changes at a specific point. Data points are connected through vertical and horizontal lines. Display symbols or fill the area.

Spline Charts
Spline charts connect the data points with smooth lines and use numeric, category, datetime, or logarithmic axis to plot data. WPF spline charts support symbols, stacking and axis rotation.
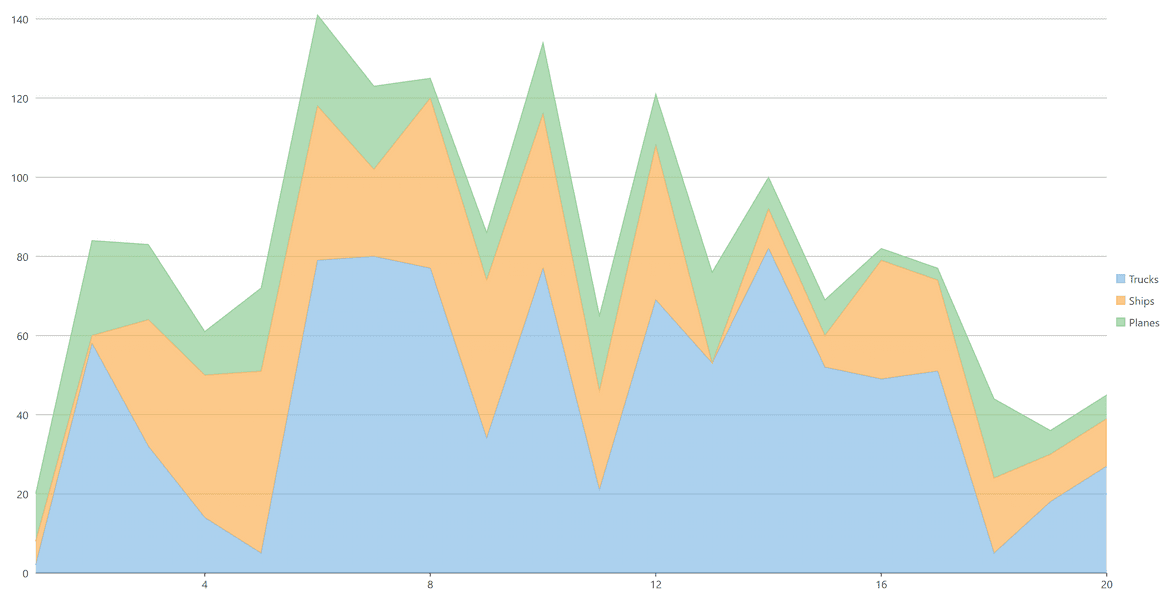
Area Charts
Fill in the area below the line to demonstrate trends in similar categories. WPF area charts support stacking, spline and axis rotation.
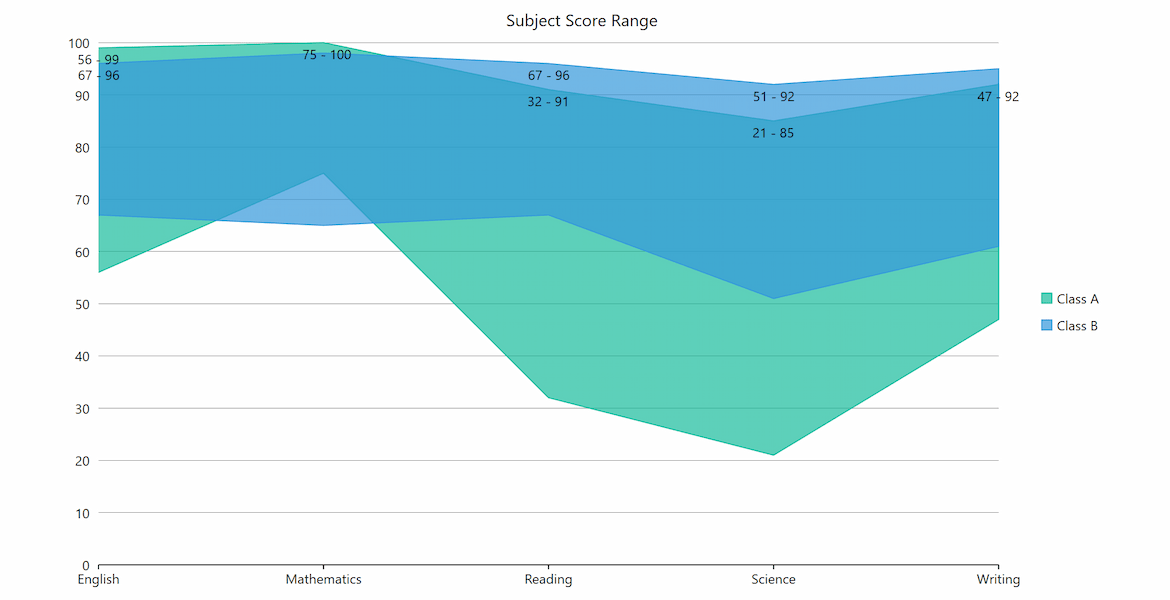
Range Area Charts
Fill in the area below the line to demonstrate trends in similar categories. Shows variations in the data values for a given time.
Scatter Charts

Scatter Charts
Demonstrate correlation between data points and a set of numerical data along the x-axis and the y-axis. WPF scatter charts combine values into single data points and display uneven intervals or clusters.

Bubble Charts
Create rich, visually appealing data modeling and financial charts with bubble charts. This WPF chart allows you to display your data series as a set of differently-sized symbols in the chart space.
Financial Charts

Candlestick Charts
The candlestick chart displays the Open, Close, High, and Low Stock Prices for each day in the series. The vertical bar spans the High and Low values for the day.

HLOC Charts
Also known as high-low-open-close, HLOC charts illustrate movements in the price of a financial instrument over time.

More Financial Charts
With Studio Enterprise you get FinancialChart, which includes 9 additional chart types including Heikin-Ashi, Kagi, Renko and more.
Pie and Sunburst Charts

Pie Charts
WPF pie charts show how parts of a whole add up to 100%. FlexPie features include doughnut, exploded slices, animation, selection, and rotation.

Sunburst Charts
Visualize hierarchical data from a root node (center) outward to lower hierarchies. A segment of the inner circle is a parent to the segments of the outer circle which lie within the angular sweep of a parent.

Multiple Pie Charts
Use FlexPie to visualize more data in a single chart by creating multiple pie chart "series" using the same data source. An effective way of presenting data, especially if the intent is to show one section relative to the whole.
Radar and Polar Charts

Radar Charts
Display multivariate observations with an arbitrary number of variables. FlexRadar supports line, area, scatter and stacked chart types.

Radar Area Charts
Create a radar area chart using FlexRadar. This visualization lets you display changes in the radar through shaded regions with stacking support.

Polar Charts
Create circular graphs to display multivariate observations with an arbitrary number of variables. FlexRadar can generate polar charts with lines, columns, filled areas and custom symbols.
Specialized WPF Chart Types

Error Bar Charts
Error bars help you see margins of error and standard deviations at a glance. They can be shown as a standard error amount, a percentage, or a standard deviation.

Box-and-Whisker Charts
Graphically depict groups of numerical data through their quartile, mean, median and outliers.

Histogram Charts
Diagram consists of rectangles whose area is proportional to the frequency of a variable and whose width is equal to the class interval. Supports ranged axes, Gaussian/bell curve, running totals and Pareto charts.

Waterfall Charts
A waterfall chart helps understand the cumulative effect of sequentially introduced positive or negative values. Optionally, display auto-calculated intermediate totals in the waterfall chart.

BreakEven Charts
A break-even chart shows the sales volume level at which total costs equal sales. The chart plots revenue, fixed costs, and variable costs on the vertical axis, and volume on the horizontal axis.

Gantt Charts
Manage a project with a Gantt chart and never miss a step. Includes dependencies and percent complete, start and end dates for each task, and information such as completion states and task dependencies.

Funnel Charts
Visualize stages of a process, such as a sales funnel, using a funnel shape. Supports triangular or rectangular shape.

TreeMap Charts
Display hierarchical information combined with relative quantity. Highlight hierarchical, tree-structured data as a set of nested rectangles and help to analyze the anomalies in the data set.

HeatMap Chart
This specialized chart represents data values using colors and is especially useful in plotting large, complex data. Customize the discrete gradient color scale and gradient color axis.
WPF Chart Features
High-Performance Rendering

FlexChart supports Direct2D rendering on the desktop for the fastest performance. DirectX is the most direct and optimal approach to drawing graphics when performance is a concern. FlexChart can render 50k data points in about 5 milliseconds on an average laptop.
Interactive Features

Zooming and Panning
Interact with the chart using mouse or tap gestures. Use pinch gesture, mouse wheel or double click to zoom in/out.

Line Markers
Add interactive line markers or cross-hairs to show information about a specific point on your chart. Line markers can snap to data points or move when the user drags the line.

Selection and Hit-Test
Select a single data point or an entire data series in your chart. Enable touch for your chart interactions. Hit-testing helps find the closest data point. FlexChart also supports drill-down.
WPF Chart Style Features

Color Palettes
Quickly choose one of FlexChart's 20 built-in color palettes, or customize your own palette with full opacity and gradient support.

Animation
Add animation when the WPF chart is loaded or when data points are updated. Choose an easing function and how to animate the data points.

Custom Data Points
Configure the chart data points individually to reflect the value. Apply conditional formatting for symbols and lines.
WPF Chart Axis Features

Scaling and Scrolling
FlexChart allows you to add axis scrollbars to the X and Y axes, allowing the user to simultaneously scroll and scale the axis to better visualize the data.

Axis Label Grouping
Improve chart readability by displaying hierarchical groups in axis labels. Avoid overlapping by wrapping labels to a second row or rotating the angle.

Axis Origin and Position
FlexChart axes are flexible and support many features. Create a quadrant chart by moving the axis origin. Compare multiple series using multiple Y axes. Reverse any axis to change the visualization.
WPF Chart Legend Features

Legend Grouping & Ranges
Legends represent the mapping between colors, symbols, and data series on a chart. Grouping the legend items hierarchically helps organize the data. Creating ranges helps visualize numeric groups.

Legend Toggle
Allow users to toggle the visibility of series through the legend. This feature is toggled on or off by setting one property on FlexChart.

Custom Legend Icons
Further customize the legend with scrolling, wrapping and custom icons.
Additional Features

Data Labels and Tooltips
Display precise chart values in labels attached to each data point. FlexChart can automatically display the formatted value or percentage within labels and tooltips. Prevent data labels from overlapping so all data is visible.

Annotations
Annotations improve clarity of the chart using arbitrary text, images and shapes that can be attached to data points or plot coordinates. You can even allow end-users to edit annotations in FlexChart.

Combination Charts
Easily combine any Cartesian chart types into a single plot using FlexChart's flexible model. Each series can be set to a different chart type, allowing endless composite chart combinations.

Multiple Plot Areas
Define multiple plot areas to display plots stacked horizontally and vertically. Stacking plot areas helps visualize multiple series in a single chart.

Trendlines
Add trend lines to show trends in data and make predictions. FlexChart supports several built-in regression and non-regression trendlines such as linear, average and polynomial.

Range Selector
With the range selector, you can enable scrolling between two charts where one is a preview of all data and one is filtered (or zoomed) to the selected range for closer analysis.
WPF Chart Demos

Desktop Demo Explorer
All of our WinForms demos are included in a single downloadable desktop explorer. Explore every .NET Framework and .NET 6+ feature using the Control Explorer demo. Plus, see the WPF chart control in action across several realistic dashboards.


