
80+ Fast JavaScript Chart Components for Enterprise Apps
Wijmo's 80+ dynamic chart types provide powerful solutions for any enterprise application
- Includes first-class Angular, React, and Vue support
- Dozens of chart elements and options
- Specialty charts included
Ideas That Inspire. Discover What's New in Our Release Section.
Overview
A JavaScript chart component is a high-performance control to visualize data in web applications. FlexChart is a JavaScript chart component with a rich UI gallery of 80+ charts and graphs, ranging from line to financial, catering to all charting scenarios.
Why Choose Wijmo for Your JavaScript Chart Component?
80+ JavaScript FlexChart Types
Line charts to radar and polar charts, we strive for full parity with Excel. Chart interactions, analytics, annotations, and more are all built-in.
Fast, High-Performing, and Lightweight
Engineered for top performance, FlexChart won't slow down your business apps-and at less than 200 KB; it will never bloat your applications.
JavaScript FlexChart Written in TypeScript
With TypeScript, you'll get an object-oriented C# feel, design-time error checking, and complete IntelliSense in Visual Studio.
Flexible and Extensible API
An extensive feature set won’t bloat the core component; it includes data binding, pixel-perfect SVG rendering & image exports.
Content Security Compliant
Wijmo is Content Security Policy (CSP) compliant, working seamlessly in JavaScript applications without compromising security.
JavaScript Bars and Columns Charts


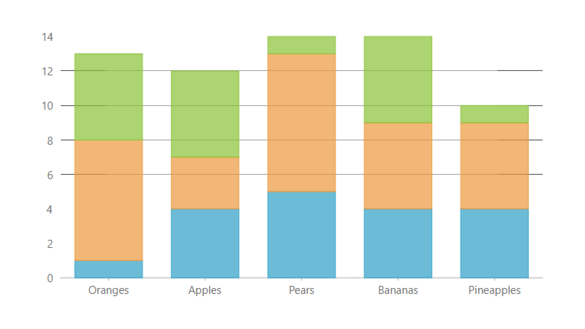
Bar Stacked Charts
Stack data points in a JavaScript bar chart. Plots data points on top of each other using horizontal bars.

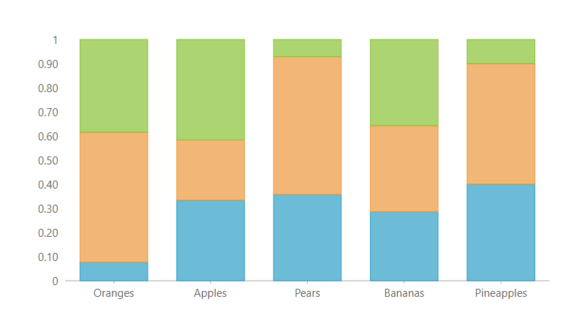
Bar Stacked 100 Charts
Compare percentages each value contributes to the total. The cumulative proportion of each stacked column always totals one hundred.

Column Charts
Similar to a bar chart, with a primarily vertical orientation. JavaScript column charts compare values across categories by using vertical bars.
Column Stacked Charts
Stack and plot data points in a column chart using vertical bars. To stack the chart values, set the FlexChart stacking property.
Column Stacked 100 Charts
The cumulative proportion of each stacked column always totals one hundred. Compare percentages each value contributes to the total.
JavaScript Line and Area Charts
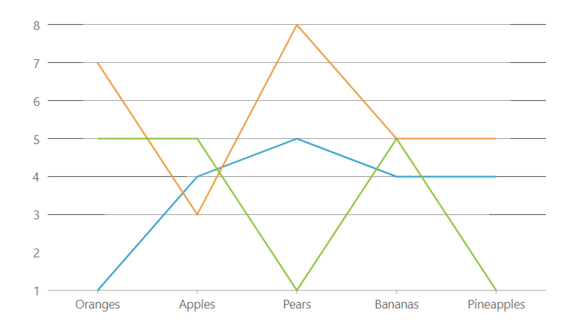
Line Charts
Display changes in data over short and long periods of time with a basic JavaScript line chart and works well with large amounts of data.
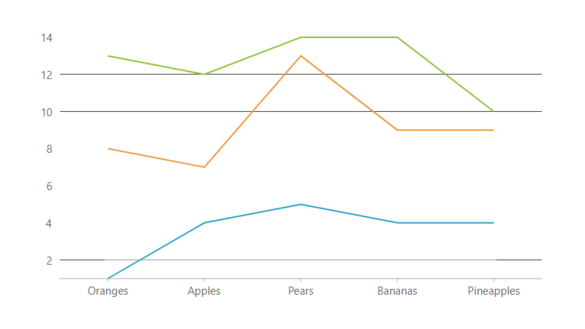
Line Stacked Charts
Stack series in a line chart. A stacked line chart is a line chart in which lines do not overlap because they are cumulative at each point.
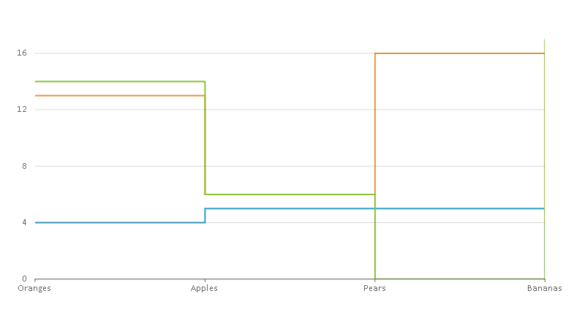
StepLine Charts
StepLine Charts help visualize changes at a specific point. Data points are connected through vertical and horizontal lines.
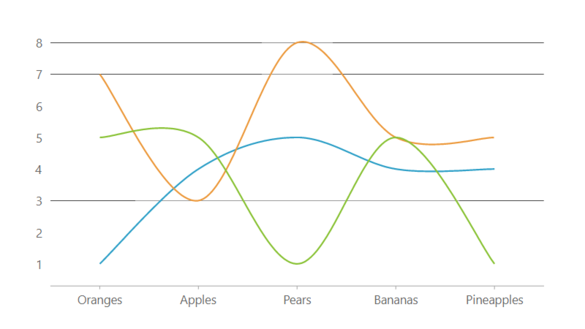
Spline Charts
Spline charts connect the data points with smooth lines and use numeric, category, datetime, or logarithmic axis to plot data.

Area Charts
Represent time-dependent data to reflect trends at equal intervals, but it fills the area below the line to demonstrate trends in similar categories.

Range Area Charts
Fill in the area below the line to demonstrate trends in similar categories. Shows variations in the data values for a given time.
JavaScript Scatter Charts
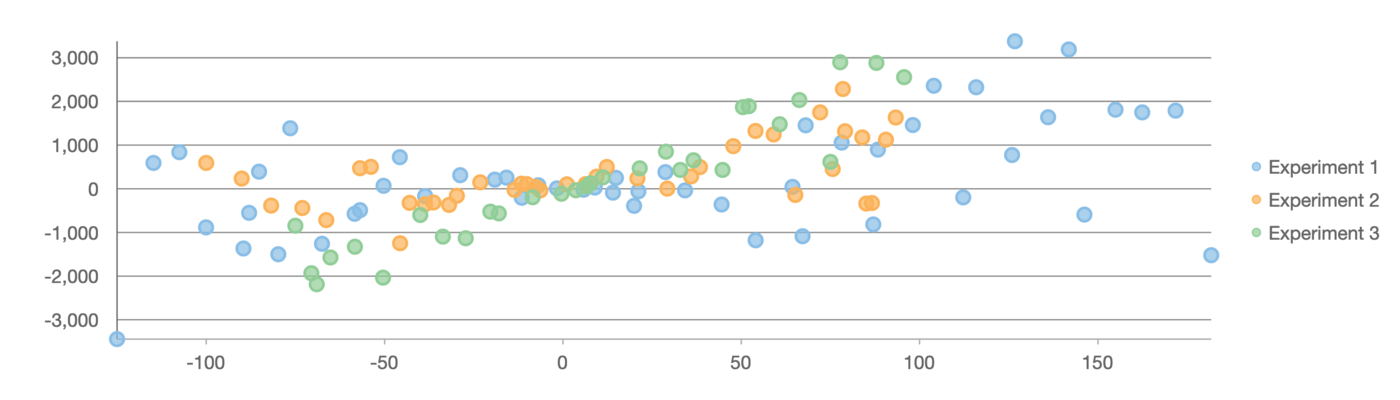
Scatter Charts
Demonstrate correlation between data points and a set of numerical data along the x-axis and the y-axis. The Scatter Chart combines values into single data points and displays uneven intervals or clusters.
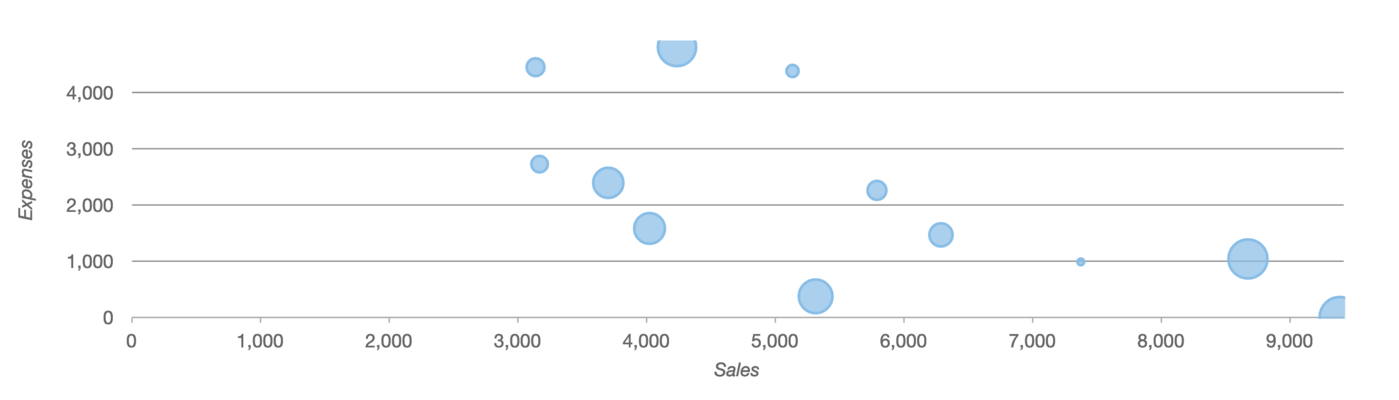
Bubble Charts
Create rich, visually appealing data modeling and financial charts with bubble charts. This JavaScript Flexchart type allows you to display your data series as a set of differently-sized symbols in the chart space.
JavaScript Financial Charts

Candlestick Chart
Visualize financial data in the Candlestick Chart. The vertical bar spans the High and Low values for the day.

HLOC Charts
Also known as high low open close, HLOC illustrates movements in the price of a financial instrument over time.
JavaScript Pie and Sunburst Charts

Pie Chart
JavaScript pie charts show how parts of a whole add up to 100%. Features include exploding slices, pie slice selection, and pie rotation.

Doughnut Charts
Set the inner radius property of the JavaScript pie chart to turn it into a doughnut. Includes all of the pie chart customizations

Sunburst Charts
Visualize hierarchical data from a root node (center) outward to lower hierarchies. A segment of the inner circle is a parent to the segments of the outer circle that lie within the parent's angular sweep.

Multiple Pie Charts
Use FlexPie to visualize more data in a single chart by creating multiple pie chart "series" using the same data source. An effective way of presenting data, especially if the intent is to show one section relative to the whole.
JavaScript Radar and Polar Charts

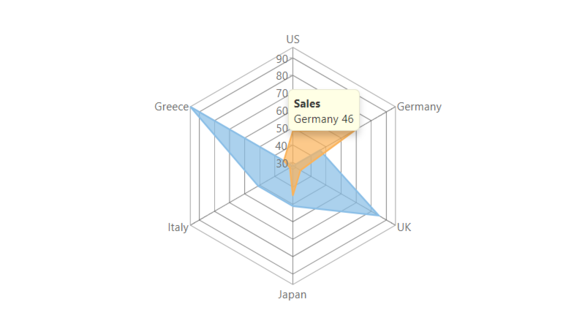
Radar Line Charts
Display multivariate observations with an arbitrary number of variables. JavaScript radar chart visualizes data in terms of values and angles.
Radar Filled Charts
Visualize data in terms of values and angles with the Fill in the areas between lines of a primary radar chart, The FlexRadar control fills the chart section, set the chart type property to area.

Polar Charts
Create circular graphs to display multivariate observations with an arbitrary number of variables. Visually compare several quantitative or qualitative aspects of a situation.
Specialized JavaScript Data Charts

BreakEven Chart
A break-even chart shows the sales volume level at which total costs equal sales. The chart plots revenue, fixed costs, and variable costs on the vertical axis, and volume on the horizontal axis.

Grouped TreeMap Charts
Display hierarchical information combined with relative quantity. Highlight hierarchical, tree-structured data as a set of nested rectangles and help to analyze the anomalies in the data set.

ErrorBar Charts
Graphically represents the variability of data to indicate the uncertainty in a measurement. The “error” isn't a mistake, but a range of data that represents a built-in uncertainty.

Funnel Charts
Visualize stages of the process in a funnel shape, such as for sales. Plots streamlined data to show various stages in a process. Adjust the funnel's height, width, and style using the options property.

Waterfall Charts
Show change in the starting position of the chart through a series of changes. A waterfall chart is a form of data visualization that helps understand the cumulative effect of sequentially introduced positive or negative values.

Funnel Rectangle Charts
Square the edges in a funnel for a different look that plots streamlined data to show various stages in a process. Use a funnel chart to show the number of sales prospects for each stage in the sales funnel.

Box-and-Whisker Charts
Visualize a group of numerical data through their quartiles (box plot). Box plots may also have lines extending vertically from the boxes (whiskers), indicating variability outside the upper and lower quartiles.

Gantt Charts
Manage a project with a Gantt chart and never miss a step. Includes dependencies and percent complete, start and end dates for each task, and information such as completion states and task dependencies.
All of Wijmo's JavaScript UI Components
Frameworks & Integrations
- Angular
- React
- Vue
- Web Components
- TypeScript
- ES6
Common
Data Management
Printing & Docs
Navigation & Layout
Input & Editors
Viewers
Designers
Featured Blogs, Videos, and Other Resources


Wijmo's Customer Feedback & Awards

"Good value for money and high quality components"
RICHARD HERBERT
"Great tools, not cheap, but worth the money for us."
TRUSTED CUSTOMER
"I've been using Wijmo controls for about a year and a half. Fantastic product. Fantastic support!"
TRUSTED CUSTOMER
 |
 |

"I don’t give kudos lightly, and without merit, but the Wijmo team has been awesome to work with. Just amazingly responsive! I am so glad I recommended Wijmo to my partners."
GABOR FARI, PARTNER TECHNOLOGY STRATEGIST - MICROSOFT CORP
"With Wijmo's extensibility model, the Microsoft Dynamics team was able to quickly customize and incorporate Wijmo 5 components into our new release."
PARAM KAHLON, GENERAL MANAGER, MICROSOFT DYNAMICS CRM ENGINEERING

"We rely on functionality of Wijmo Core's FlexGrid in our massive next-generation platform products. Wijmo's modern, full-featured FlexGrid with sophisticated grid manipulations is what you will find at the heart of our workflow."
AARON MENDEZ, MANAGER OF THE USER EXPERIENCE, THOMSON REUTERS
Trusted by the World's Leading Companies
